Assets Home Page - The Upcoming Task Table
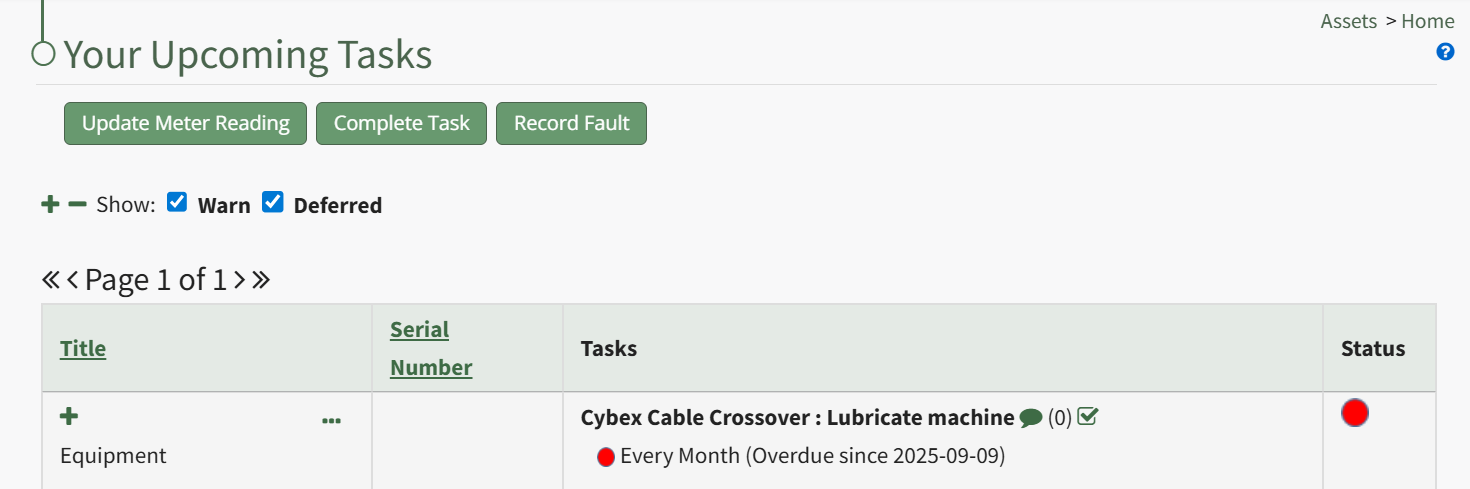
The Home Page in the Assets Module is labeled with the header Your Upcoming Tasks and displays the user’s upcoming tasks or workorders for the day that are associated with the assets that individual has been assigned responsibility for. The Upcoming Task Table includes the asset/subcomponent title, asset serial number, upcoming tasks and their status.

The Home Page has three buttons for Upcoming Task Management that are explained in the Assets Home Page Button Explanation Table below. The icons allow for page viewing customization.
Assets Home Page Button Explanation Table | |
Button | Associated Action |
Update Meter Reading | Clicking the Update Meter Reading button will open a modal that prompts you to select the asset the meter is associated with. The appropriate meter can then be selected from the Update Meter Reading Modal. How To: Update a Meter ReadingIn order to update an asset's meter reading, go to the Assets Module Home Page opening the Upcoming Tasks Table. Click the “Update Meter Reading" button from the Asset Module Homepage.
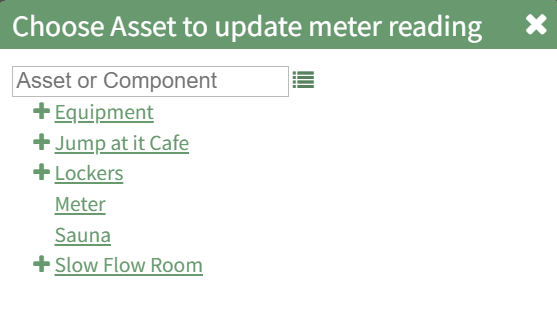
The Choose Asset Modal will prompt you to identify which asset you want to log data for. Click the bulleted list icon to access your assets. Selecting the plus sign “+” icon will expand the components within the Asset. Selecting “Update Meter Reading” from the Upcoming Task Table Context Menu will open the same modal for the specified asset.
Select the appropriate asset, opening the Update Meter Reading Modal.
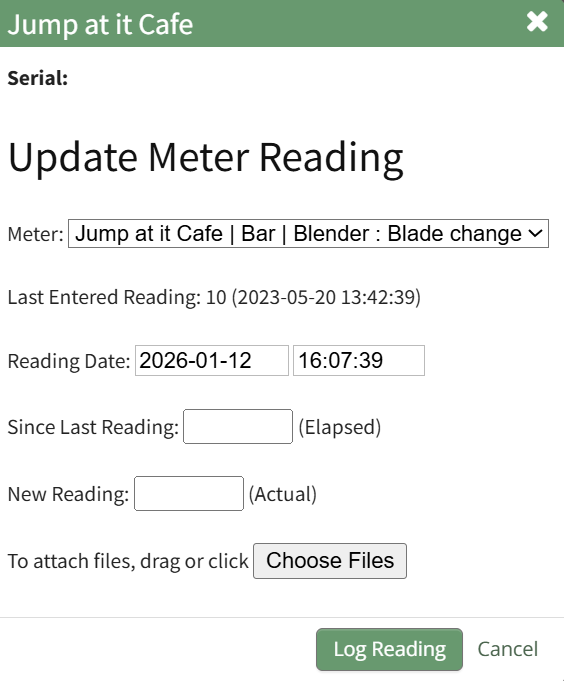
The meters associated with the asset/component selected show in a dropdown menu. Select the meter whose meter data you wish to record. The most recent meter reading shows in the Update Meter Reading Modal as the “Last Entered Reading.” KAStrack automatically inputs the current date and time. The user can enter an elapsed value (if preferred) and KAStrack will input the new actual, or the user can input the new meter reading and the elapsed value will be automatically input. Attach any files (if there are checklists, forms, etc.) associated with the meter reading. Select the “Log Reading” button to update the meter usage. Click cancel to return to the Assets Module Homepage. |
Complete Task | Selecting the Complete Task button will open a modal that prompts you to select the asset the task is associated with. The completed task(s) can be selected via checkbox on the Complete Task Modal. How To: Log a Task has been CompletedIn order to log that a task has been completed and is current/up to date (a green task status), go to the Upcoming Task Table on the Home Page of the Assets Module. Select the “Complete Task” button from the top of the Your Upcoming Tasks Page.
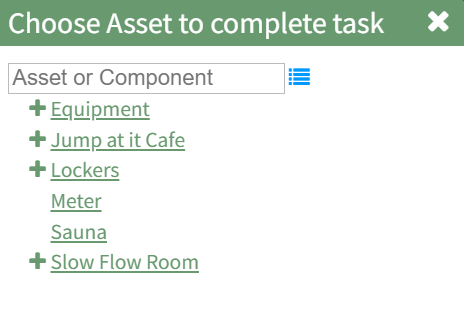
The Choose Asset Modal will prompt you to identify which asset you want to log data for. Click the bulleted list icon to access your assets. Selecting the plus sign “+” icon will expand the components under the asset. Selecting “Complete Task” from the three dot (…) context menu to the right of the asset / component title will open the same modal for the specified asset.
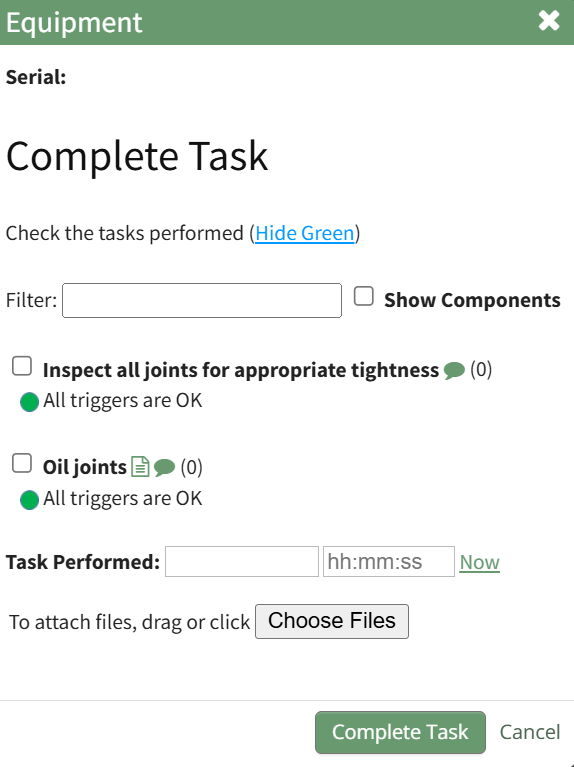
Select the appropriate asset, opening the asset's Complete Task Modal. Click the green View All clickable link to list all tasks associated with the selected asset, including tasks that are current / up to date (green status).
Serial numbers and the asset description will show at the top of the modal. Clicking the “Show Subcomponents” checkbox shows any subcomponent tasks associated with the asset, expanding the modal when selected. Beneath the task in bold is a note that indicates the parameters for the task, referred to as a trigger in KAStrack. Triggers refer to the task behavior, frequency or usage standards that KAStrack will applies to tasks to determine their schedule for completion. To log the task, select the checkbox of the completed task. You can manually enter the date (MM/DD/YYYY format) and time (hh:mm:ss format) that the task was completed, or select “Now” in order to input the current date and time. Click the “Complete Task” button to save the changes and complete the task. Click cancel to return to the Assets Module Homepage. |
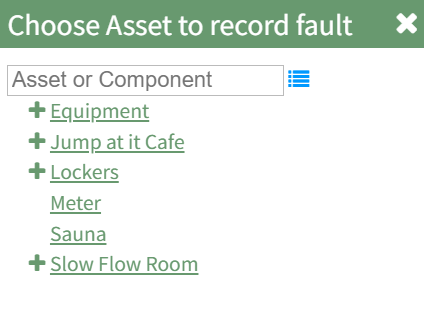
Record Fault | Selecting the Record Fault button will open a modal that prompts you to select the asset the fault is associated with. The fault can then be recorded through the Record Fault Modal. How To: Record a FaultLogging faults allows your company to track trending data in KAStrack by recording incidents and any data associated with this issue/failure. In order to record fault with an equipment issue/failure, go to the Upcoming Task Table on the Asset Module Homepage and select the "Record Fault" button beneath the page header.
The Choose Asset Modal will prompt you to identify which asset you want to log data for. Click the bulleted list icon to access your assets. Selecting the plus sign “+” icon will expand the components within the Asset. Selecting “Record Fault” from the three dot (…) context menu will open the same modal for the specified asset.
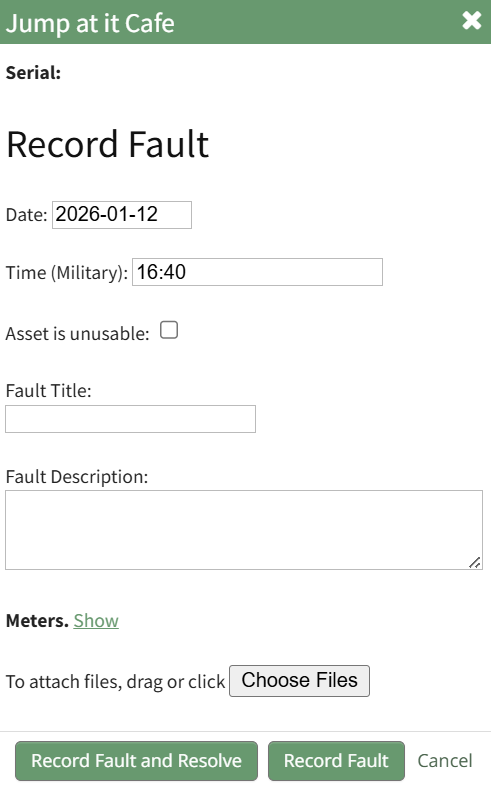
Select the appropriate asset, opening the Record Fault Modal.
Select the “Log Fault” button to record the incident. Select the “Log Fault and Resolve” button to complete two actions in one step: log the issue and indicate that it has been addressed. Click cancel to return to the Assets Module Homepage. |
| Selecting the plus sign icon expands the view of the Upcoming Task Table, showing tasks organized by sub-components and not just the parent asset. |
| Selecting the minus sign icon collapses the View of the Upcoming Task Table, grouping all sub-component tasks together and listing them under the parent asset. |

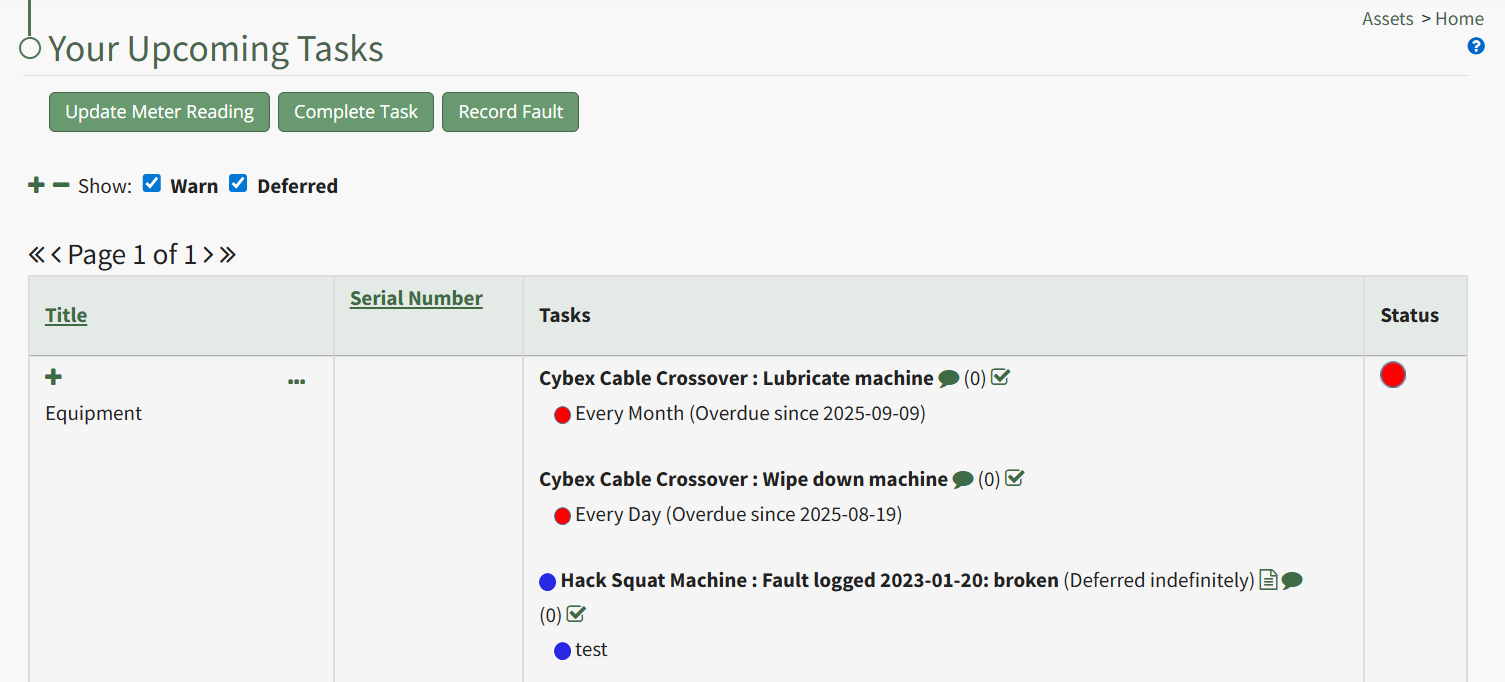
Checkboxes allow you to include / exclude tasks that are deferred or have a warning status associated with them.
The Assets/Task Status Color Legend and icons associated with the Upcoming Task Table are explained in the Upcoming Task Page Icon Explanation Table below.
Upcoming Task Page Icon Explanation Table | |
Icon | Meaning |
| The page icon indicates that there is a dialogue box with additional information regarding the task. When clicked, an Additional Information Sections with notes appears. |
| The double page icon indicates that a document has been uploaded in the Assets Module for review. Files in the Asset Module are saved independently from the Documents Module. |
| The task note icon opens a text box that allows a user to add notes without completing the task since the last completed maintenance. Any notes previously added interim notes for this task will show under the text box. |
| The number within parenthesis indicates the number of comments that have been made since the last completed maintenance. |
| The checkbox icon is a quick link that opens the Complete Task Modal that is used to mark a task as completed and up to date. How To: Log a Task has been CompletedIn order to log that a task has been completed and is current/up to date (a green task status), go to the Upcoming Task Table on the Home Page of the Assets Module. Select the “Complete Task” button from the top of the Your Upcoming Tasks Page.
The Choose Asset Modal will prompt you to identify which asset you want to log data for. Click the bulleted list icon to access your assets. Selecting the plus sign “+” icon will expand the components under the asset. Selecting “Complete Task” from the three dot (…) context menu to the right of the asset / component title will open the same modal for the specified asset.
Select the appropriate asset, opening the asset's Complete Task Modal. Click the green View All clickable link to list all tasks associated with the selected asset, including tasks that are current / up to date (green status).
Serial numbers and the asset description will show at the top of the modal. Clicking the “Show Subcomponents” checkbox shows any subcomponent tasks associated with the asset, expanding the modal when selected. Beneath the task in bold is a note that indicates the parameters for the task, referred to as a trigger in KAStrack. Triggers refer to the task behavior, frequency or usage standards that KAStrack will applies to tasks to determine their schedule for completion. To log the task, select the checkbox of the completed task. You can manually enter the date (MM/DD/YYYY format) and time (hh:mm:ss format) that the task was completed, or select “Now” in order to input the current date and time. Click the “Complete Task” button to save the changes and complete the task. Click cancel to return to the Assets Module Homepage. |
| A greet status icon in the Assets Module indicates that a task is current and up to date. |
| A yellow status icon in the Assets Module is a warning that a deadline is upcoming. |
| A red status icon in the Assets Module indicates that a task is past due. |
| A blue status icon in the Assets Module indicates that a task has been deferred. |
| A grey status icon in the Assets Module indicates that an asset or component is out of service. Any sub-component would also be archived. |
| A white status icon in the Assets Module indicates that an asset or component is archived. Any sub-component would also be archived. |
| A purple status icon in the Assets Module indicates that a before task linked to a deferred corrective action. |
| A yellow triangle status icon in the Assets Module is a warning that a critical item has an upcoming deadline |
| A red triangle status icon in the Assets Module indicates that a critical item is past due. |
Tasks are grouped together and displayed in the Upcoming Task table by asset, highlighting the tasks that are not current / up to date.
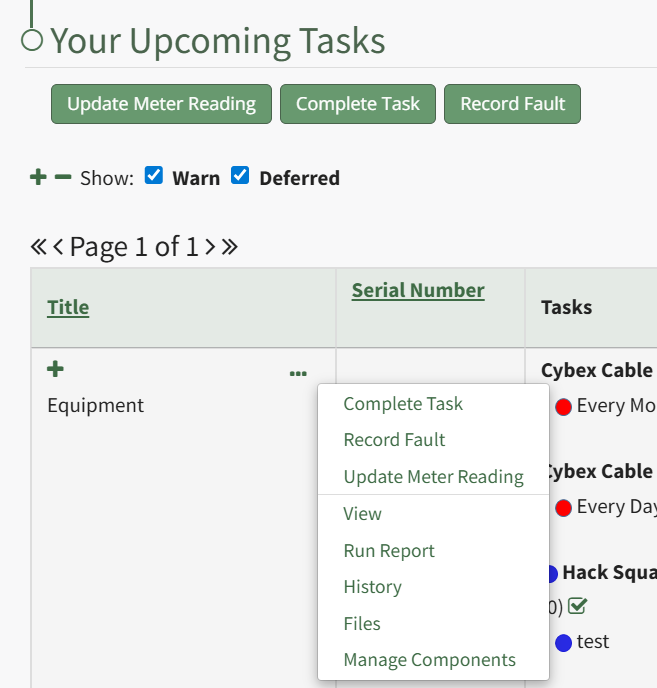 To the right of each asset title is a three-dot icon that opens a context menu with a list of options for quick task management. The Upcoming Task Table Context Menu Options are explained in the table below.
My Upcoming Tasks Table Context Menu Option Explanations | |||||||||||||||||||||||||
Option | Explanation | ||||||||||||||||||||||||
Complete Task | Selecting “Complete Task” on the context menu opens the Complete Task Modal, allowing a user to record necessary details and mark the task as complete. How To: Log a Task has been CompletedIn order to log that a task has been completed and is current/up to date (a green task status), go to the Upcoming Task Table on the Home Page of the Assets Module. Select the “Complete Task” button from the top of the Your Upcoming Tasks Page.
The Choose Asset Modal will prompt you to identify which asset you want to log data for. Click the bulleted list icon to access your assets. Selecting the plus sign “+” icon will expand the components under the asset. Selecting “Complete Task” from the three dot (…) context menu to the right of the asset / component title will open the same modal for the specified asset.
Select the appropriate asset, opening the asset's Complete Task Modal. Click the green View All clickable link to list all tasks associated with the selected asset, including tasks that are current / up to date (green status).
Serial numbers and the asset description will show at the top of the modal. Clicking the “Show Subcomponents” checkbox shows any subcomponent tasks associated with the asset, expanding the modal when selected. Beneath the task in bold is a note that indicates the parameters for the task, referred to as a trigger in KAStrack. Triggers refer to the task behavior, frequency or usage standards that KAStrack will applies to tasks to determine their schedule for completion. To log the task, select the checkbox of the completed task. You can manually enter the date (MM/DD/YYYY format) and time (hh:mm:ss format) that the task was completed, or select “Now” in order to input the current date and time. Click the “Complete Task” button to save the changes and complete the task. Click cancel to return to the Assets Module Homepage. | ||||||||||||||||||||||||
Record Fault | Selecting “Record Fault” on the context menu opens the Record Fault Modal, allowing a user to record any necessary details about a fault. How To: Record a FaultLogging faults allows your company to track trending data in KAStrack by recording incidents and any data associated with this issue/failure. In order to record fault with an equipment issue/failure, go to the Upcoming Task Table on the Asset Module Homepage and select the "Record Fault" button beneath the page header.
The Choose Asset Modal will prompt you to identify which asset you want to log data for. Click the bulleted list icon to access your assets. Selecting the plus sign “+” icon will expand the components within the Asset. Selecting “Record Fault” from the three dot (…) context menu will open the same modal for the specified asset.
Select the appropriate asset, opening the Record Fault Modal.
Select the “Log Fault” button to record the incident. Select the “Log Fault and Resolve” button to complete two actions in one step: log the issue and indicate that it has been addressed. Click cancel to return to the Assets Module Homepage. | ||||||||||||||||||||||||
Update Meter Reading | Selecting “Update Meter Reading” on the context menu opens the Update Meter Reading Modal, allowing a user to record details regarding a meter reading. How To: Update a Meter ReadingIn order to update an asset's meter reading, go to the Assets Module Home Page opening the Upcoming Tasks Table. Click the “Update Meter Reading" button from the Asset Module Homepage.
The Choose Asset Modal will prompt you to identify which asset you want to log data for. Click the bulleted list icon to access your assets. Selecting the plus sign “+” icon will expand the components within the Asset. Selecting “Update Meter Reading” from the Upcoming Task Table Context Menu will open the same modal for the specified asset.
Select the appropriate asset, opening the Update Meter Reading Modal.
The meters associated with the asset/component selected show in a dropdown menu. Select the meter whose meter data you wish to record. The most recent meter reading shows in the Update Meter Reading Modal as the “Last Entered Reading.” KAStrack automatically inputs the current date and time. The user can enter an elapsed value (if preferred) and KAStrack will input the new actual, or the user can input the new meter reading and the elapsed value will be automatically input. Attach any files (if there are checklists, forms, etc.) associated with the meter reading. Select the “Log Reading” button to update the meter usage. Click cancel to return to the Assets Module Homepage. | ||||||||||||||||||||||||
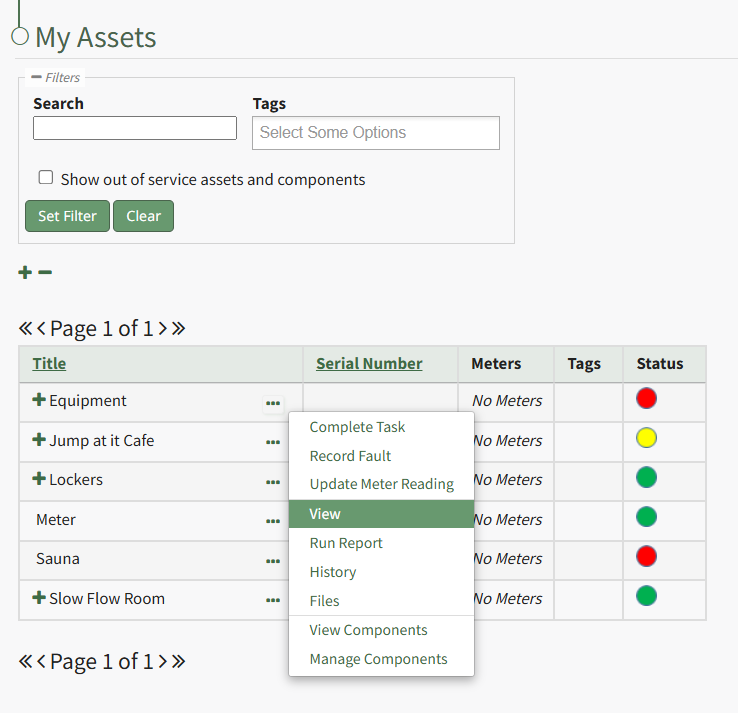
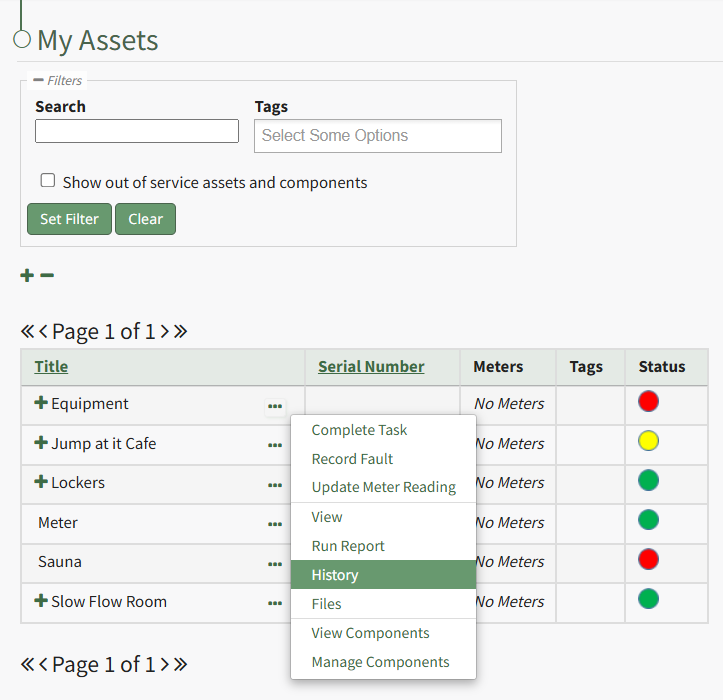
View | Selecting “View” from the context menu opens an Asset Summary Modal with a summary of the asset/component information. The read-only modal displays details, any associated meters, sub-components, assignments, and tasks associated with an asset. How To: View an Asset's Summary ModalTo view an asset's summary modal that lists all relevant information regarding an asset, go to the My Assets Page under the Assets Module on the Main Menu. Use filters as needs to pull up the asset you wish to view. Click the three-dot icon to the right of the asset/component title opening the context menu and select "View".
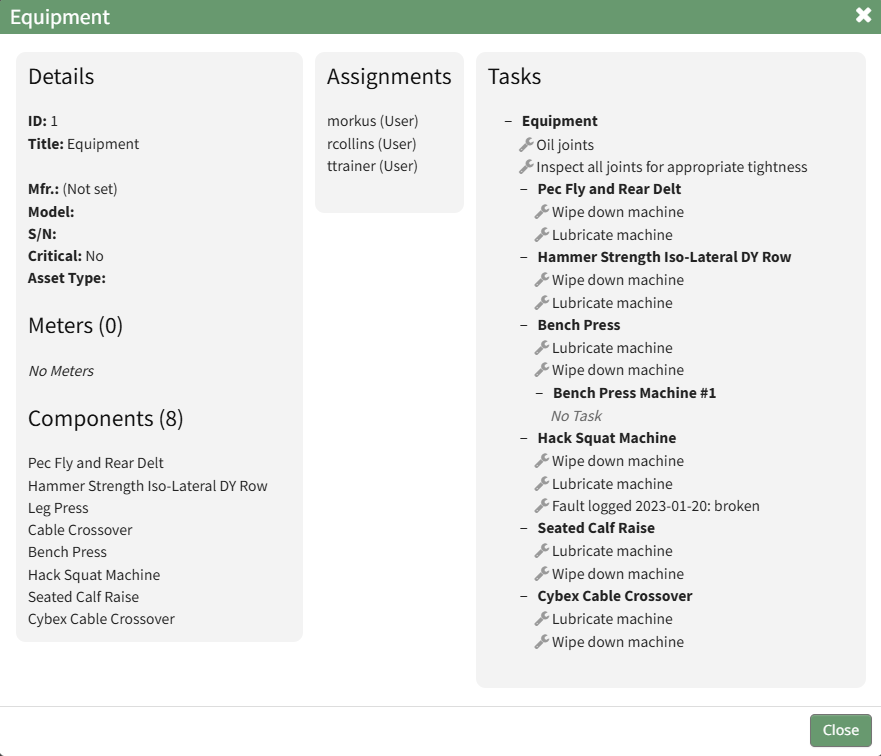
This opens the Asset Summary Modal. The read-only modal shows the asset details, meters associated with the asset, lists the components of the asset, the users assigned to the asset, and any tasks on the asset's task schedule.
Click the close button to return to the My Assets Page. | ||||||||||||||||||||||||
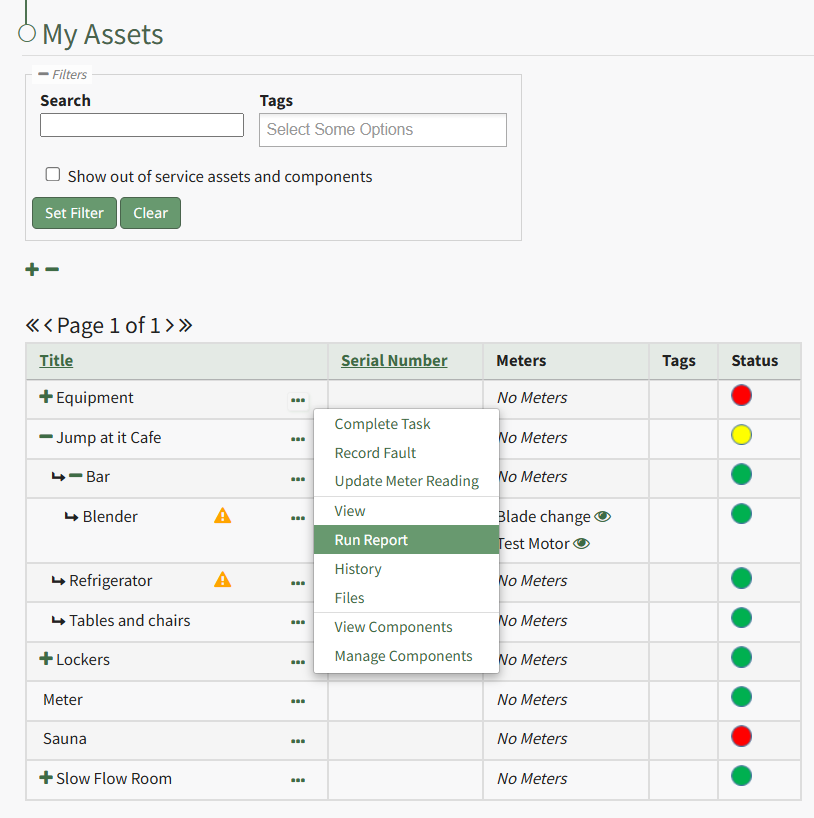
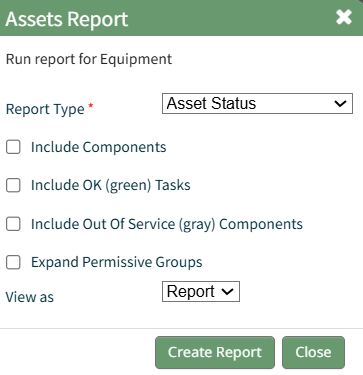
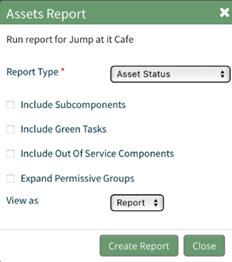
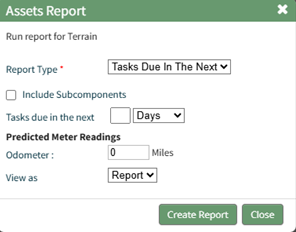
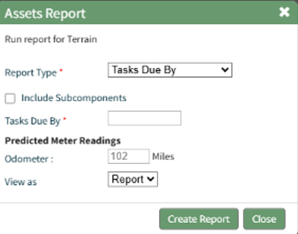
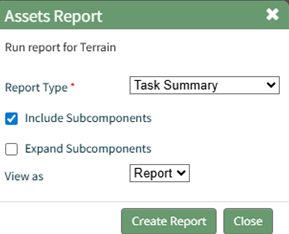
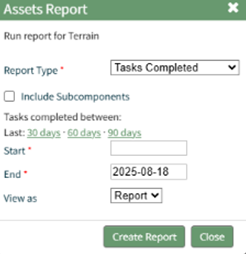
Run Report | Selecting “Run Report” from the context menu open the Assets Report Modal, allowing the user to select between five customizable Asset Reports. How To: Run an Asset ReportTo run an asset report, open the My Asset Page in the Assets Module on the Main Menu. Use filters as needed and identify the asset/component you want to run a report on. Click the three-dot icon to the right of the asset title opening a context menu.
Select "Run Report" from the context menu opening the Assets Report Modal with options for running various types of reports.
Reports can be run for an asset in its entirety, specific components or subcomponents. They type of report can be selected from a dropdown menu on the Assets Report Modal. An explanation of report types is included in the table below.
Select the "Create Report" button after completing the inputs on the Assets Report Modal and the system will generate your report in the viewing preference you selected. | ||||||||||||||||||||||||
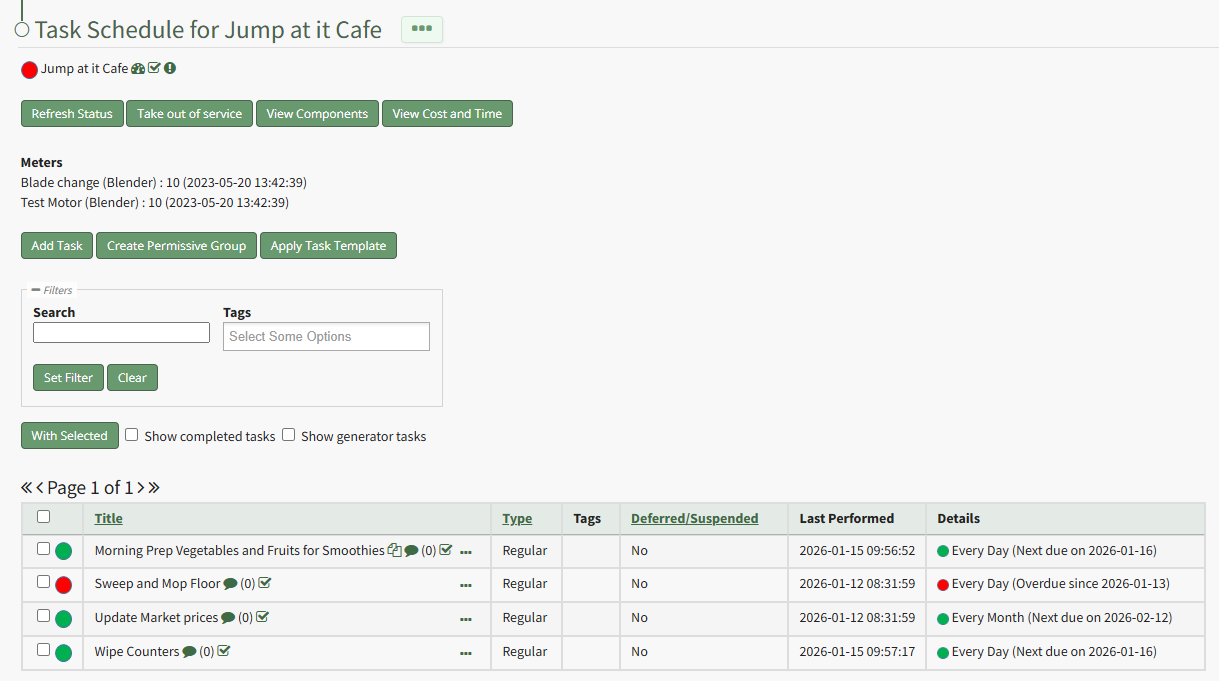
History | Selecting “History” from the context menu opens the Asset History Page with historical entries for the components/sub-components that were selected. The Asset History Page contains four historical logs - tasks completed, tasks deferred, as well meter and fault logs. How To: View an Asset's Historical LogsAn asset's historical data can be accessed from an asset's History Page. To access an asset's history, go to the My Assets Page in the Assets Module on the Main Menu. Use the filters as needed to identify the access whose history you wish to view, and click the three-dot icon to the right of the asset name. This opens a context menu.
Select "History" from the context menu opening the Asset History Page. | ||||||||||||||||||||||||
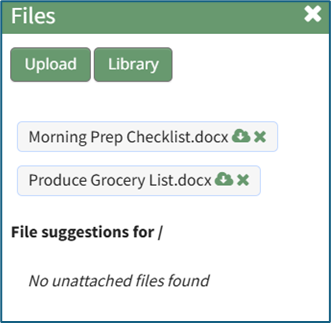
Files | Selecting “Files” from the context menu will open the Files Modal and display any files attached to the asset or component. Only users with appropriate permissions will be able to access files associated with an asset or task. How To: View a File Attached to a TaskTo view a file associated with a specific task, open the Task Schedule Page for the asset of interest. How To: View an Asset's Task ScheduleAn asset's historical data can be accessed from an asset's History Page. To access an asset's history, go to the My Assets Page in the Assets Module on the Main Menu. Use the filters as needed to identify the access whose history you wish to view, and click the three-dot icon to the right of the asset name. This opens a context menu.
Select "History" from the context menu opening the Asset History Page.
Click the three dot (…) icon next to the right of title whose files you wish to view on the Task Schedule Table opening the context menu. Select “Task Files” opening the Files modal.
Any files associated with the task are shown on the Files modal. | ||||||||||||||||||||||||
Manage Components | Selecting “Manage Components” from the context menu will open the Manage Asset Components Page where assets and their components can be managed. Only users with appropriate permissions will have access to this page. | ||||||||||||||||||||||||
No comments to display
No comments to display