Understanding Forms
Creating a New Form
When new forms are created, a form creator has options regarding basic form settings, advanced form settings, and form styling options. Reference the How To: Create a New Form for a detailed explanation of each setting.
How To: Create a New Form
{{@386}}
Preview Mode
When new forms are created in KAStrack, the form originates in a Not Live - Preview Mode. This allows the form to be designed, setup and configured before it is live. It is recommended that you use preview mode until you are sure that your form has been setup correctly. Entries can be made when a form is in Preview Mode, but a message will be displayed on the webform modal that states that the form is not yet live and that any submissions made can be deleted.
Deleting Testing Entries
It is a best practice to delete all testing entries by selecting the “Delete All Entries” option from the three-dot icon to the right of a form title on the Home Page that opens the Form Table context menu. This option will only be available when a form is in preview mode. This prevents any testing entries from being confused with real entries when your form goes live.
How To: Delete All Testing Entries
{{@392}}
Making a Form Live
To make a form live, select “Make Form Live” from the Form Table Context menu. Once a form is live, you will not be able to return to preview mode or bulk delete entries.
How To: Make a Form Live
{{@404}}
Viewing a Form's Report (in the Report Module)
When forms are submitted in KAStrack, the form entries can be viewed in the Reports Module. Each entry will be recorded with a database entry ID, approval status, the username of the individual who submitted the entry if they are a KAStrack system user, the entry date, and the most recent entry update.
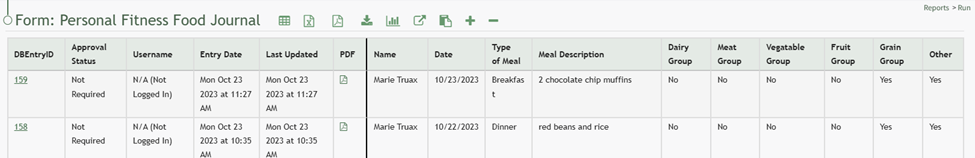
A PDF of the form entry is also generated by the system and is accessible via the form specific context menu option “Download PDF” or the PDF Icon in the Form Report Table.
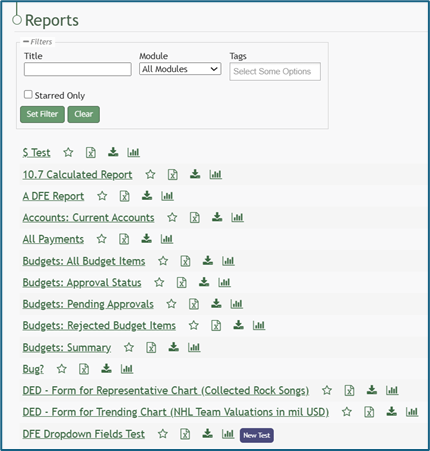
You can access the form report, by going to the Home Page of the Forms Module and select the three-dot icon to the right of the specific form and select “View Entries”.
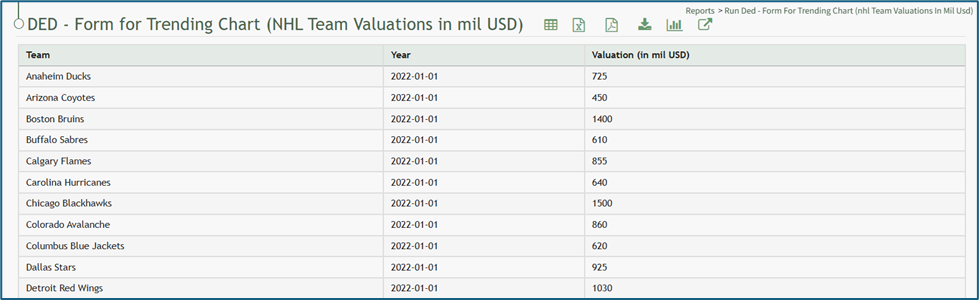
There are icons to the right of the Form Page header that act as quick links for efficient action. The icons are explained in the Form Page Icon Table below.
Form Report Icon Explanations | ||||||||||||||||||||||||||||||||||||||||
Icon | Explanation | |||||||||||||||||||||||||||||||||||||||
| The spreadsheet icon converts the table into a datatables table format (allowing for filtering by column and pagination of the table). | |||||||||||||||||||||||||||||||||||||||
| The PDF icon opens a web-based PDF of the report in the same browser tab. | |||||||||||||||||||||||||||||||||||||||
| The excel icon will download the report in an excel (.xlsx) file to your personal device. | |||||||||||||||||||||||||||||||||||||||
| The download icon opens the Download Modal which allows an individual to select from seven different formats to download the report from a dropdown menu. Possible download formats are listed to the right. How To: Download a ReportTo download a report, go to the Home Page of the Reports Module. There are two icons to the right of the Report Title that allow an individual to download a report.
Selecting the excel icon will automatically download the report to your personal device. Selecting the download icon will open the Download Modal. There are seven different download options to choose from on the dropdown menu.
Select the “Generate” button and KAStrack will download your report based on the method of your choosing. The icons to download a report can be found within a specific report and the Manage Reports Page (for individuals with an Admin access level). | Comma Separated Values (.csv) | ||||||||||||||||||||||||||||||||||||||
Tab Separated Values (.tsv) | ||||||||||||||||||||||||||||||||||||||||
Other Separated Values (.txt) | ||||||||||||||||||||||||||||||||||||||||
Open Document Format (.ods) | ||||||||||||||||||||||||||||||||||||||||
Excel 97 (.xls) | ||||||||||||||||||||||||||||||||||||||||
Excel 2007 and later (.xlsx) | ||||||||||||||||||||||||||||||||||||||||
| The chart icon opens the Chart Wizard Modal, allowing an individual to create a chart from the data generated by the report. Hot To: Create a ChartTo create a chart, go to the Home Page of the Reports Module and open the report you wish to use for the necessary chart data. How To: Run a ReportTo run a report, go to the Home Page of the Reports Module.
Click the name of the report you wish to run.
Select the chart icon to the right of the report title header. This opens the Report Module Chart Wizard Modal. The chart icon for a specific report is also accessible on the Home Page of the Reports Module.
After specifying the appropriate inputs for the chart, select “View Chart” to see a preview of the representation of the data. If no additional changes are needed, select “Save Chart”. A confirmation modal states, “The chart has been saved.”
The new chart is now visible on the Charts Page of the Reports Module. | |||||||||||||||||||||||||||||||||||||||
| The external link icon opens the External Connection Modal which offers a detailed explanation on how to transmit report data to Power BI. |
| ||||||||||||||||||||||||||||||||||||||