Reports: Module Pages
- Reports Home Page
- Charts Page
- Manage Reports Page: Custom Reports Tab
- Manage Reports Page: System Reports
- Settings Page: Reports Module Level Tab
- Reports Wizard Page
Reports Home Page
The Reports Home Page is where all available system and custom reports are housed. Clicking on the report title will open the report. Refer to System Reports for a detailed explanation of the 11 system generated reports.

A filter box at the top of the Home Page allows an individual to search by report title, by module, tag, or if the report was starred.
Reports Module Home Page Icon Explanations | ||||||||||||||||||||||||||||||||||||||||
Icon | Explanation | |||||||||||||||||||||||||||||||||||||||
| The star icon stars a report (marking the report as important). This acts as an additional filter, as you can filter by “Starred Only” on the Reports Home Page. | |||||||||||||||||||||||||||||||||||||||
| The excel icon will download the report in an excel (.xlsx) file to your personal device. | |||||||||||||||||||||||||||||||||||||||
| The download icon opens the Download Modal which allows an individual to select from seven different formats to download the report from a dropdown menu. Possible download formats are listed to the right. How To: Download a ReportTo download a report, go to the Home Page of the Reports Module. There are two icons to the right of the Report Title that allow an individual to download a report.
Selecting the excel icon will automatically download the report to your personal device. Selecting the download icon will open the Download Modal. There are seven different download options to choose from on the dropdown menu.
Select the “Generate” button and KAStrack will download your report based on the method of your choosing. The icons to download a report can be found within a specific report and the Manage Reports Page (for individuals with an Admin access level). | Comma Separated Values (.csv) | ||||||||||||||||||||||||||||||||||||||
Tab Separated Values (.tsv) | ||||||||||||||||||||||||||||||||||||||||
Other Separated Values (.txt) | ||||||||||||||||||||||||||||||||||||||||
Open Document Format (.ods) | ||||||||||||||||||||||||||||||||||||||||
Excel 97 (.xls) | ||||||||||||||||||||||||||||||||||||||||
Excel 2007 and later (.xlsx) | ||||||||||||||||||||||||||||||||||||||||
| The chart icon opens the Chart Wizard Modal, allowing an individual to create a chart from the data generated by the report. How To: Create a ChartTo create a chart, go to the Home Page of the Reports Module and open the report you wish to use for the necessary chart data. How To: Run a ReportTo run a report, go to the Home Page of the Reports Module.
Click the name of the report you wish to run.
Select the chart icon to the right of the report title header. This opens the Report Module Chart Wizard Modal. The chart icon for a specific report is also accessible on the Home Page of the Reports Module.
After specifying the appropriate inputs for the chart, select “View Chart” to see a preview of the representation of the data. If no additional changes are needed, select “Save Chart”. A confirmation modal states, “The chart has been saved.”
The new chart is now visible on the Charts Page of the Reports Module. | |||||||||||||||||||||||||||||||||||||||


Charts Page
The Charts Page of the Reports Module displays a table of all charts that have been created by or shared with an individual.

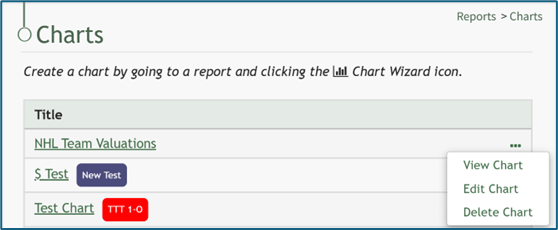
If an individual created the chart, the three dot icon opening the chart table context menu will be visible. If a chart was shared with an individual, the three dot icon accessing the context menu will not be visible. The Chart Table Context Menu displays options to view, edit, or delete a chart.
Chart Table Context Menu Explanations | ||
Option | Comments | Image |
View Chart | Selecting “View Chart” from the context menu opens a Chart Modal that shows the selected chart. |
|
Edit Chart | Selecting “Edit Chart” from the context menu opens the Chart Wizard Modal, allowing an individual to make changes to the chart properties while viewing a preview of the chart. How To: Edit a ChartTo edit a chart, go to the Charts Page of the Reports Module. To be able to edit a chart, you must be the individual who created the chart.
Click the three-dot icon to the right of the chart you wish to edit and select “Edit Chart”. This opens the Chart Wizard, where the data type, values for the independent and dependent axis, chart type, chart size, chart title, and tags can be edited. If you select the “Share this Chart” checkbox, anyone who can view the report the chart is based will have access to the chart. Individuals will only see the data they have access to.
Make the desired edits to the chart. Select the “View Chart” button to preview your edits.
When you are satisfied with your edits, select the “Save Changes” button. A confirmation modal states, “The chart has been saved,” and you will be redirected to the Charts Page.
|
|
Delete Chart | Selecting “Delete Chart” from the context menu opens the Delete Chart Confirmation Modal. How To: Delete a ChartTo delete a chart, go to the Charts Page of the Reports Module. To be able to delete a chart, you must be the individual who created the chart.
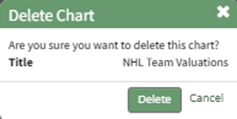
Click the three-dot icon to the right of the chart you wish to delete, and select the “Delete Chart” option. This opens the Delete Chart Confirmation Modal which states, “Are you sure wish to delete this chart?” The modal also states the title of the chart being deleted. If the chart had Share this Chart enabled, deleting the chart will remove its visibility from all individuals it was previously shared with.
Click the “Delete” button and a Confirmation Modal states, “This chart has been deleted.”
|
|
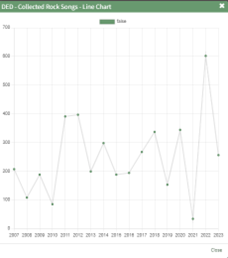


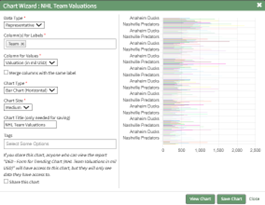


Charts are created based on the data from a specific report. To create a chart, select the chart wizard icon on a report page or from the Reports Module Home Page.
How To: Create a Chart
To create a chart, go to the Home Page of the Reports Module and open the report you wish to use for the necessary chart data.
How To: Run a Report
To run a report, go to the Home Page of the Reports Module.
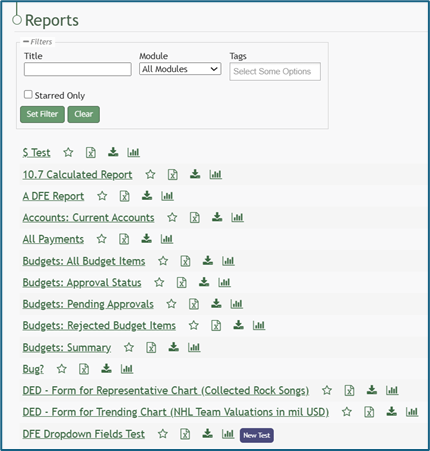
Click the name of the report you wish to run.
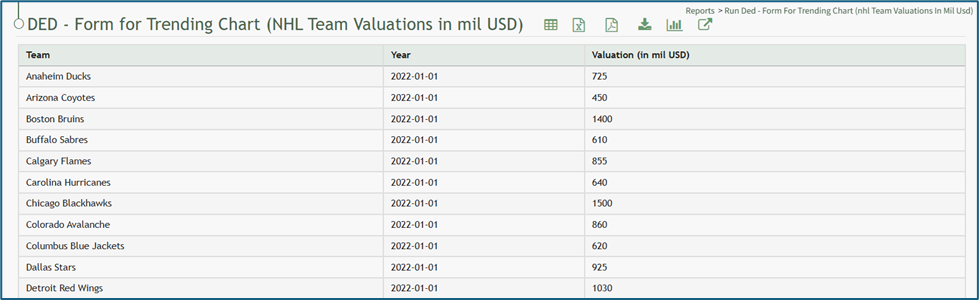

Select the chart icon to the right of the report title header. This opens the Report Module Chart Wizard Modal.
The chart icon for a specific report is also accessible on the Home Page of the Reports Module.

Chart Wizard Modal Explanation | ||
Input | Comments | |
Data Type (required) | Representative | Trending* |
Chart Type (required)
Options are based on the data type. | Bar Chart (Vertical) | Line Chart |
Bar Chart (Horizontal) | ||
Pie Chart | ||
Line Chart | ||
Doughnut Chart | ||
Column for Labels (required) | For representative data, any field can be selected as your independent axis. | *For trending data, the label (independent axis) should be a value representing the date. |
Column for Values (required) | The dependent axis must be linked with a column that contains numeric values for a chart to be made. | |
Merge Columns with the same label Checkbox | When the merge columns with the same label checkbox is selected, the numeric values input will be added together and the total shown on the chart as opposed to individual values. | |
Chart Size (required) | Options: Small, Medium, Large, X-Large, Max | |
Tags | Select open, restrictive, or permissive tags as desired. | |
Share this chart Checkbox | If you share this chart, anyone who can view the report will have access to the chart, but they will only see data they have access to. | |
View Chart | Selecting the View Chart button will expand the Chart Wizard Modal and show a preview of the chart being generated. | |
After specifying the appropriate inputs for the chart, select “View Chart” to see a preview of the representation of the data. If no additional changes are needed, select “Save Chart”. A confirmation modal states, “The chart has been saved.”

The new chart is now visible on the Charts Page of the Reports Module.
Manage Reports Page: Custom Reports Tab
The Manage Reports Page is where individuals with a Reports Module Admin or Manager Module Level can create and manage reports. The Manage Reports Page is comprised of two tabs: Custom Reports and System Reports. The selected tab will be white, not green.
The Custom Reports Tab houses the Custom Reports Table showing any available custom reports created by users.

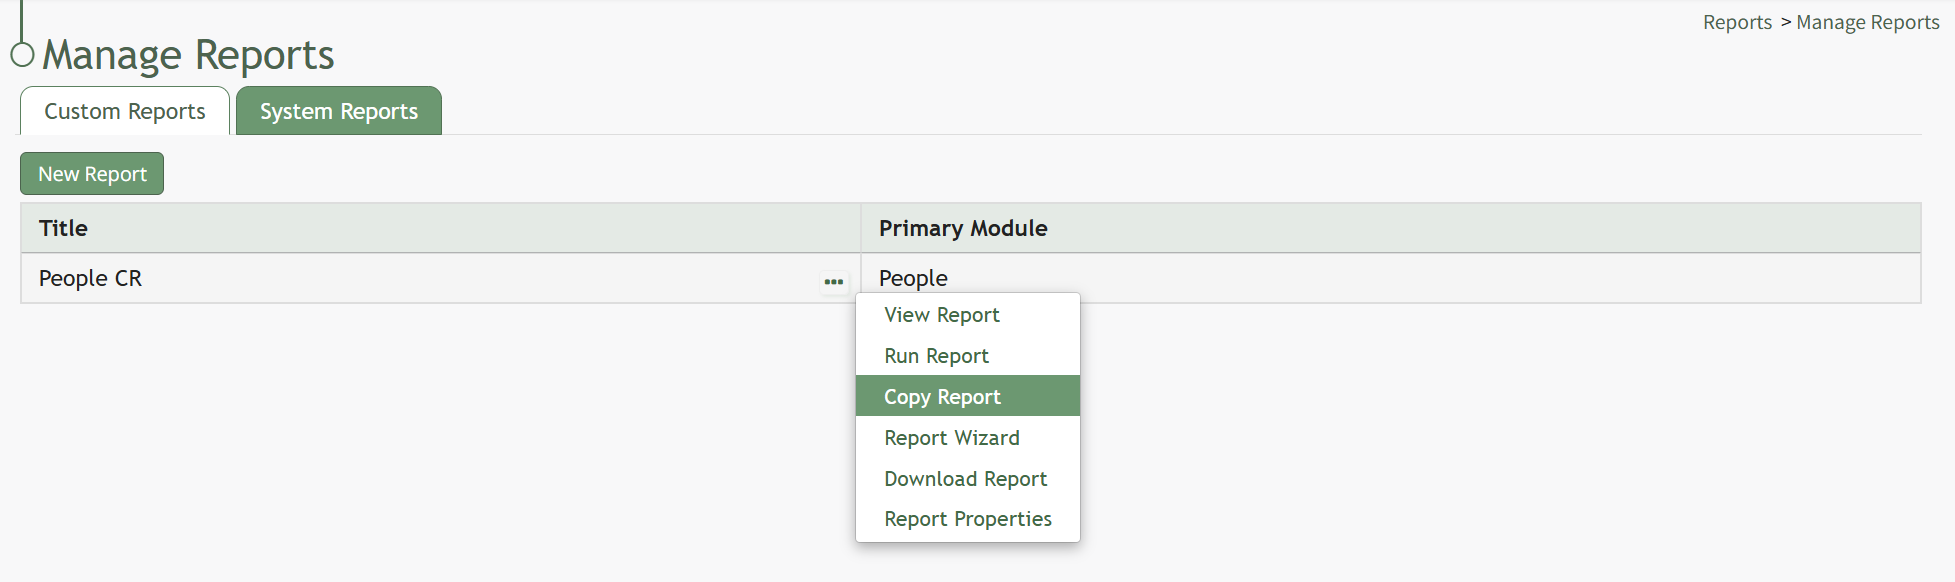
The Custom Report Table has a context menu accessible from the three-dot icon to the right of the custom report name.
Custom Report Content Menu Explanations | ||||||||||||||||||||||||||||||||
Option | Comments | |||||||||||||||||||||||||||||||
View Report | Selecting “View Report” from the context menu opens the View Report Modal which states the Report Title, the Primary Module, the creation date and time, and shares the Link Path if the report is public. | |||||||||||||||||||||||||||||||
Run Report | Selecting “Run Report” from the context menu runs the selected report and opens the report page showing all the data within. How To: Run a ReportTo run a report, go to the Home Page of the Reports Module.
Click the name of the report you wish to run.
| |||||||||||||||||||||||||||||||
Copy Report | Selecting “Copy Report” from the context menu opens the Copy Report Modal which allows you to rename and create the copied report. How To: Copy a ReportSystem Reports cannot be copied. To copy a report, go to the Custom Reports Tab of the Manage Reports Page in the Reports Module. Select the three-dot icon to the right of the Report Title opening the context menu.
Select “Copy Report” opening the Copy Report Modal.
Input the new title to be associated with the copied report and select the “Copy” button.
The copied report will now be shown in the Custom Reports Table. | |||||||||||||||||||||||||||||||
Report Wizard | Selecting “Report Wizard” from the context menu opens the Report Wizard Page, which is used to customize a report after it has been created. | |||||||||||||||||||||||||||||||
Download Report | Selecting “Download Report” from the context menu opens the Download Report Modal which offers seven options on a dropdown menu for download formatting. How To: Download a ReportTo download a report, go to the Home Page of the Reports Module. There are two icons to the right of the Report Title that allow an individual to download a report.
Selecting the excel icon will automatically download the report to your personal device. Selecting the download icon will open the Download Modal. There are seven different download options to choose from on the dropdown menu.
Select the “Generate” button and KAStrack will download your report based on the method of your choosing. The icons to download a report can be found within a specific report and the Manage Reports Page (for individuals with an Admin access level). | |||||||||||||||||||||||||||||||
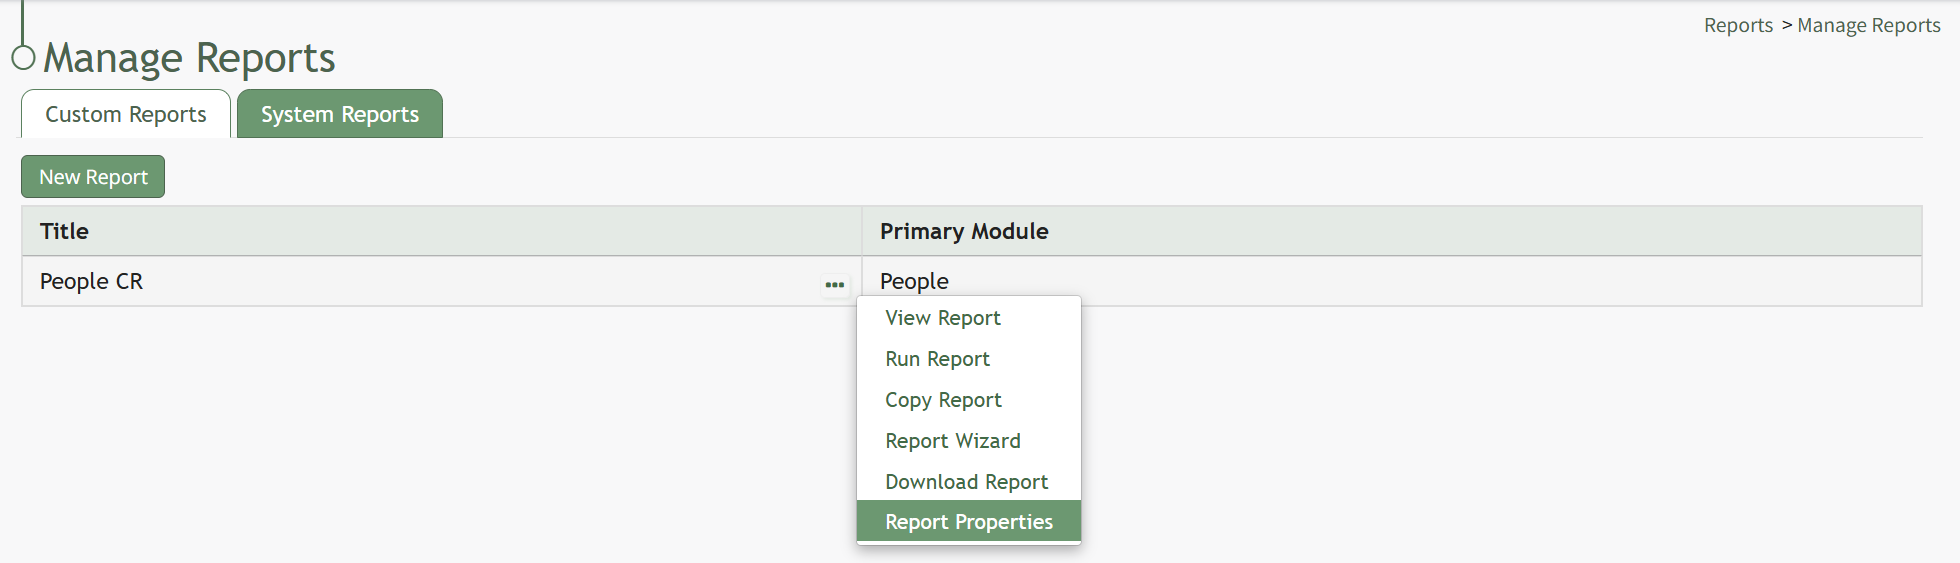
Report Properties | Selecting “Report Properties” from the context menu opens the Report Properties Modal, allowing an individual to alter their choices made on the New Report Modal. How To: Edit a ReportSystem Reports cannot be edited. To edit a report, go to the Custom Reports Tab of the Manage Reports Page in the Reports Module. Select the three-dot icon to the right of the Report Title opening the context menu.
Select “Report Properties” opening the Report Properties Modal.
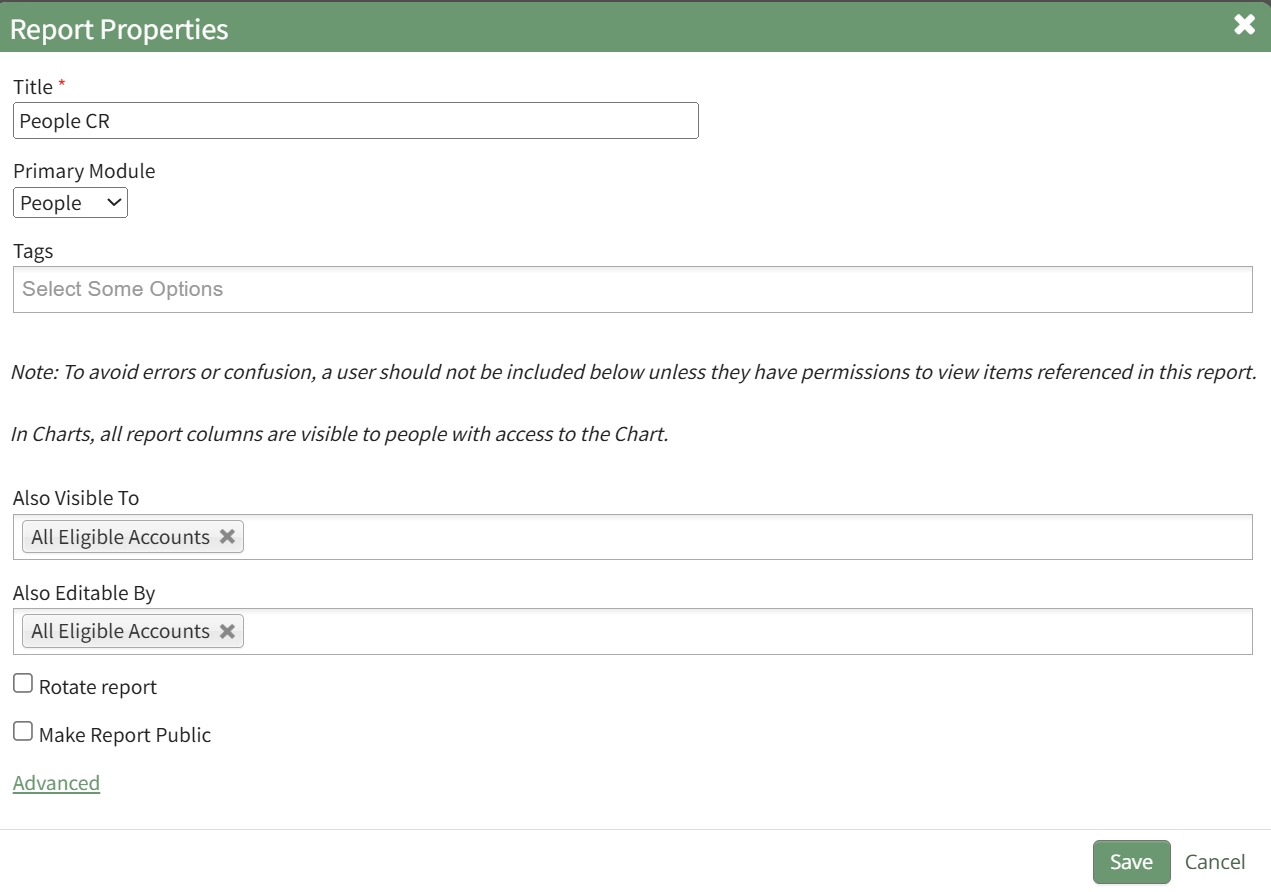
Refer to the New Report Modal Comments Table for an explanation of Edit Report Modal inputs.
Select the “Save” button after making your desired changes and you’ll return to the Custom Reports Table. | |||||||||||||||||||||||||||||||
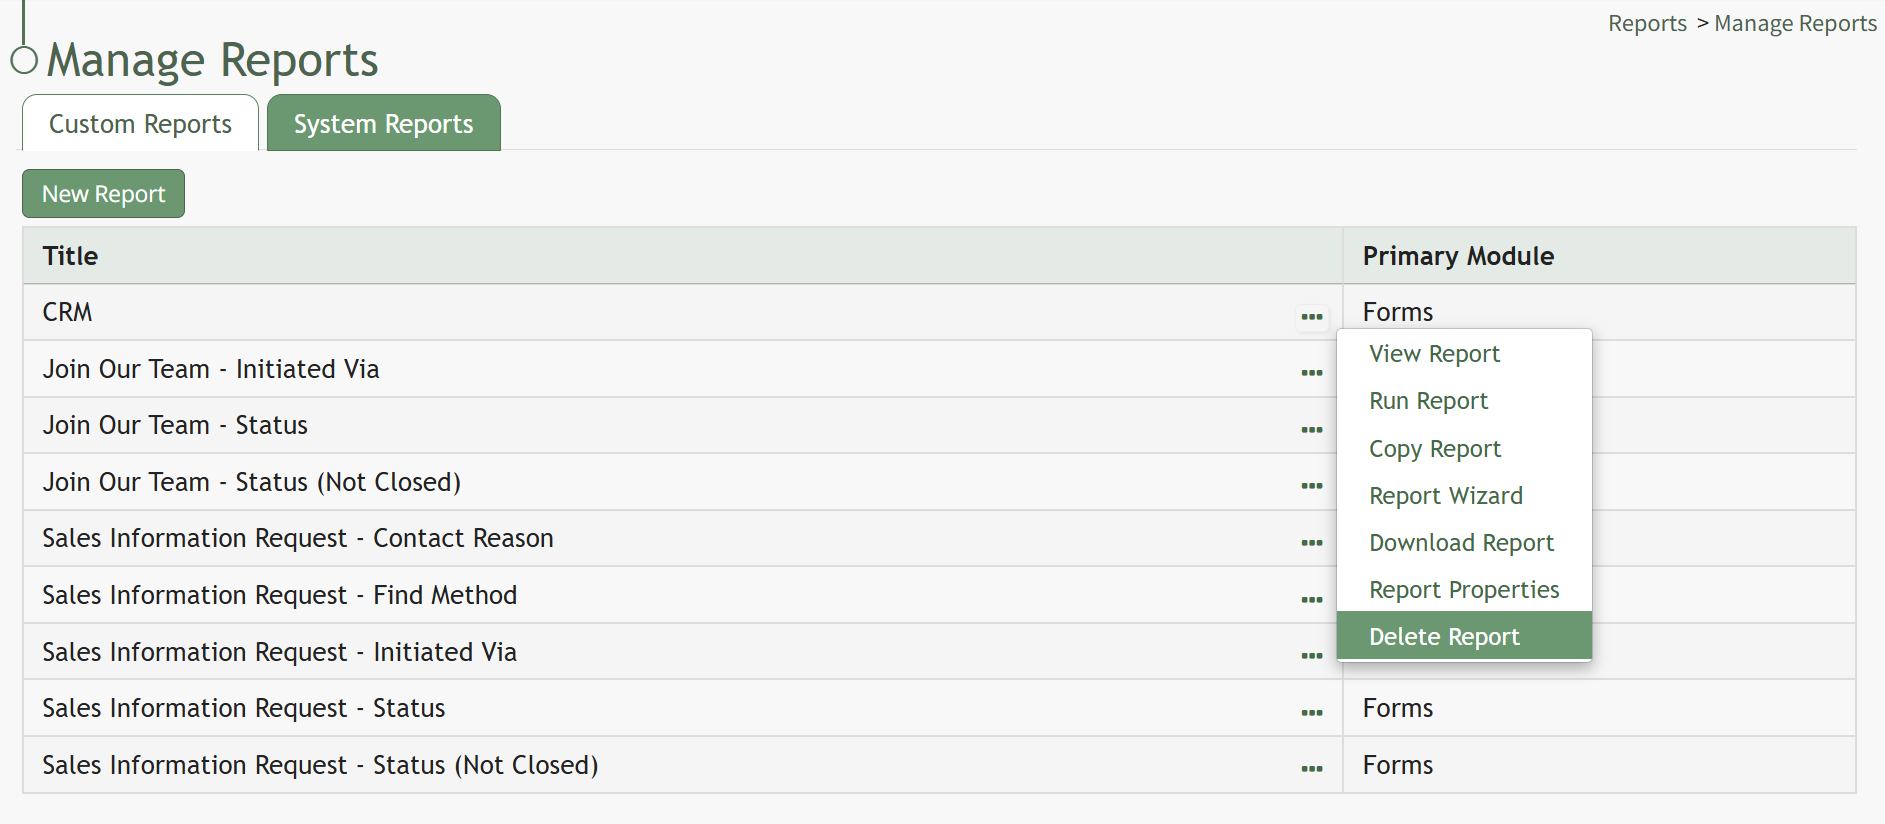
Delete Report | Selecting “Delete Report” from the context menu opens the Delete Report Confirmation Modal that lists the title of the report to be deleted with the question, “Are you sure you want to delete this report?” How To: Delete a ReportSystem Reports cannot be deleted. To delete a report, go to the Custom Reports Tab of the Manage Reports Page in the Reports Module. Select the three-dot icon to the right of the Report Title opening the context menu.
Select “Delete Report” opening the Delete Report Confirmation Modal.
The modal will state the name of the report and the question, “Are you sure you want to delete this report?” Select the “Delete” button. A confirmation modal will state, “This report has been deleted,” before returning to the Custom Reports Table.
| |||||||||||||||||||||||||||||||




Manage Reports Page: System Reports
The System Reports Tab houses the System Reports table and the possible system generated reports that are based on data from the Accounts, Finance, and People Modules.

System Report Context Menu Explanations | |||||||||||||||||||
Option | Explanation | ||||||||||||||||||
Run Report | Selecting “Run Report” will run the selected report and take the individual to the report page showing all the data within. How To: Run a ReportTo run a report, go to the Home Page of the Reports Module.
Click the name of the report you wish to run.
| ||||||||||||||||||
Download Report | Selecting “Download Report” will open the Download Modal, providing a dropdown menu with seven different formatting options for the download. How To: Download a ReportTo download a report, go to the Home Page of the Reports Module. There are two icons to the right of the Report Title that allow an individual to download a report.
Selecting the excel icon will automatically download the report to your personal device. Selecting the download icon will open the Download Modal. There are seven different download options to choose from on the dropdown menu.
Select the “Generate” button and KAStrack will download your report based on the method of your choosing. The icons to download a report can be found within a specific report and the Manage Reports Page (for individuals with an Admin access level). | ||||||||||||||||||
Permissions | Selecting “Permissions” will open the Assign Permissions Modal. How To: Assign Permissions to a Custom ReportTo assign permissions to a custom report, go to the Custom Reports Tab on the Manage Reports Page of the Reports Module. Select the three-dot icon to the right of the Report Title opening the context menu.
Select “Report Properties” opening the Edit Report Modal.
Permissions can be given for visibility through the “Also visible to” dropdown menu. Permissions for editing can be granted through the “Also editable by” dropdown menu. You can select individual names, certification roles, People I Supervise, or All Eligible Accounts for either option. Select “Save” and the visibility and editing permissions will now be effective. Visibility restrictions applied to the report via Tags will be considered last when determining who the report is visible to. How To: Assign Permissions to a System ReportTo assign Permissions for a System Report, go to the System Reports Tab on the Manage Reports Page of the Reports Module.
Select the three-dot icon to the right of the system report you wish to alter permissions for opening the system report table context menu. Select “Permissions” opening the Access to (SystemReport Name) Report Modal.
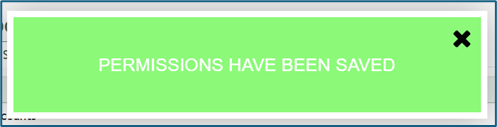
Add individual people, certification roles, or access levels from the dropdown menu. Users still require the ‘run-report’ and/or ‘download-report’ permissions to be able to run or download system reports that they have permission to access. Select “Save” to change who has access to the report. A confirmation modal will appear stating, “Permissions have been saved,” and you will return to the System Reports Tab of the Manage Reports Page.
| ||||||||||||||||||


Settings Page: Reports Module Level Tab
The Module Levels Tab of Settings Page can be accessed from the Main Menu. The system default module levels for the module are visible in the Module Levels Table. New module levels with customizable permissions can be created and managed on this tab.
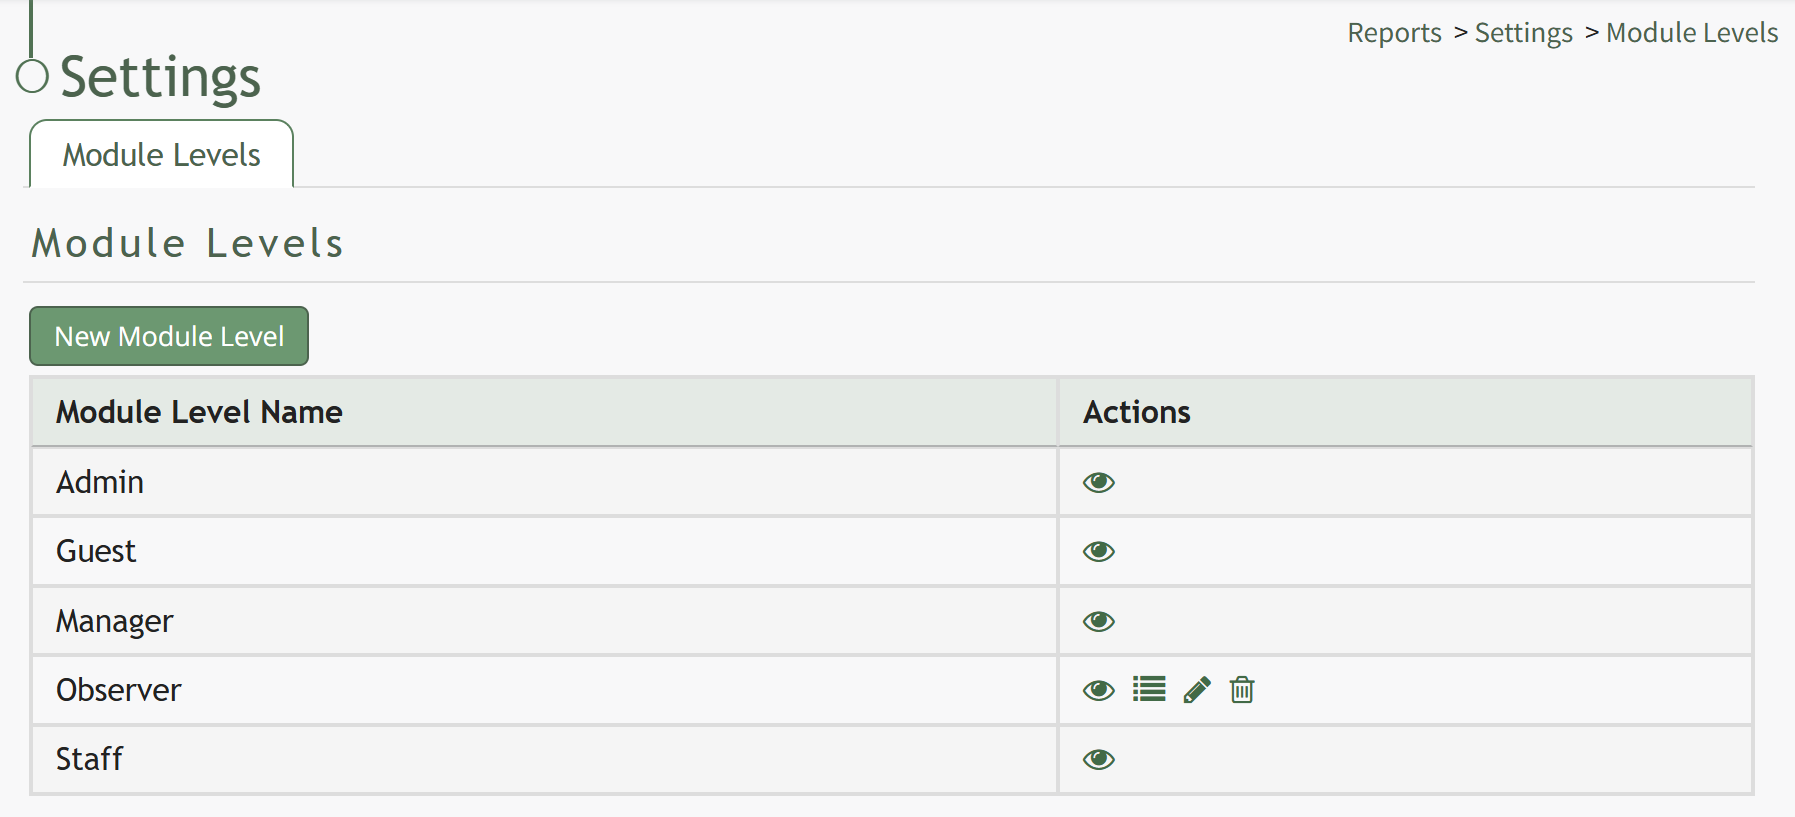
There are four system default module levels associated with the Reports Module. An explanation of the permissions associated with each default module level are shown in the Reports Module Level Permissions Table below.
System default module levels cannot be customized.
Reports Module Level Permissions Table | |
Module Level | Permissions |
Admin | Download Report, Run Report, Manage Charts (list / view / edit / delete chart), Manage Reports (add / view / edit / delete report, edit SQL, share with any certification role, share with any user, share with all accounts, list-manage reports, edit system reports), Manage roles (delete / edit / view / add / assign / unassign roles, assign role test, assign hidden role, role permissions, assign role Kastrack Admin) |
Guest | None |
Manager | Download Report, Run Report, Manage Charts (list / view / edit / delete chart), Manage Reports (add / view / edit / delete report, edit SQL, share with any certification role, share with any user, share with all accounts, list-manage reports, edit system reports) |
Staff | Download Report, Run Report |
New Module Levels can be created in order to customize module level permissions to suit your organization's needs. An explanation of the icons associated with customized module levels have been provided in the table below.
Module Level Customization Icons | |
Icon | Explanation |
| The eyeball icon allows you to view users assigned to the module level as well as the permissions assigned to them. |
| The bulleted list icon allows you to assign permissions to customized module levels. |
| The pencil icon opens the Edit Module Level Modal. |
| The trashcan icon opens the Delete Module Level Confirmation Modal. |


How To: Create a Custom Module Level (Reports Module)
To add a new module level in the Reports Module, go to the Settings Page and select the “New Module Level” button.

This opens the New Module Level Modal.
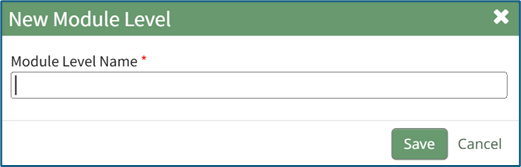
Input a name for the new module level and select the “Save” button.
The new module level will now be shown in the module level table on the Settings Page. Module levels created by your organization can be customized. Select the bulleted list icon to add permissions to the new module level.

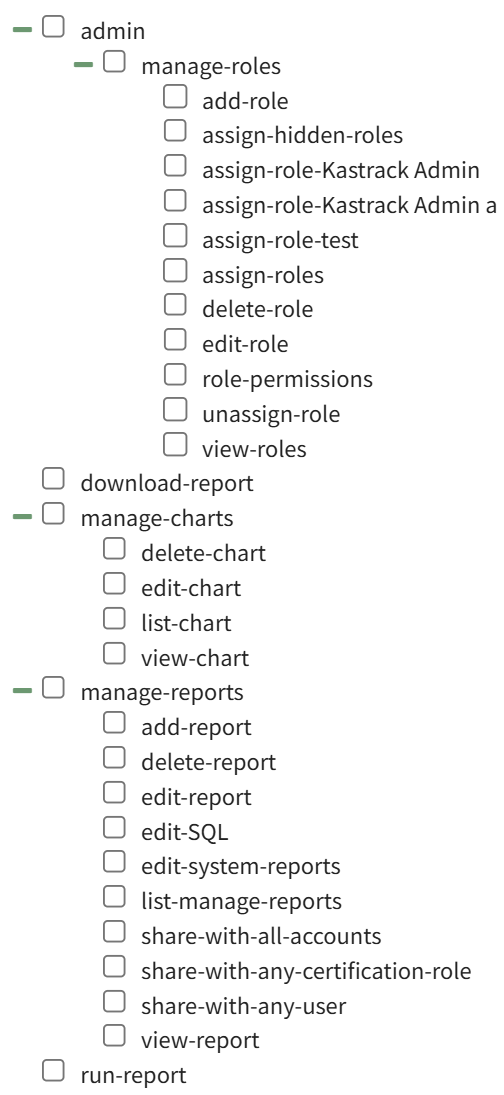
Click the checkboxes for the permissions you would like to be granted to the new module level.
Select “Save” when done adding permissions.
A complete list of all permissions associated with the Reports Module have been provided below.
Reports Wizard Page
The Report Wizard Page is used to design and customize individual reports.

The Report Wizard is divided into the following
tabs: Columns, Restrictions, Options, Preview and Save. You can advance from tab to tab without losing changes
but must click the Save Tab before leaving the Report Wizard Page or changes made will be lost.
The Save Tab functions as a button and does not open to a new page.
Columns Tab
The Columns Tab allows an individual to select
the desired columns for the report from different tables utilized in the primary module that was selected for
the report.
The Primary Module can be changed by selecting Edit Report from the Context Menu on the Manage page.
How To: Edit a Report
System Reports cannot be edited.
To edit a report, go to the Custom Reports Tab of the Manage Reports Page in the Reports Module. Select the three-dot icon to the right of the Report Title opening the context menu.
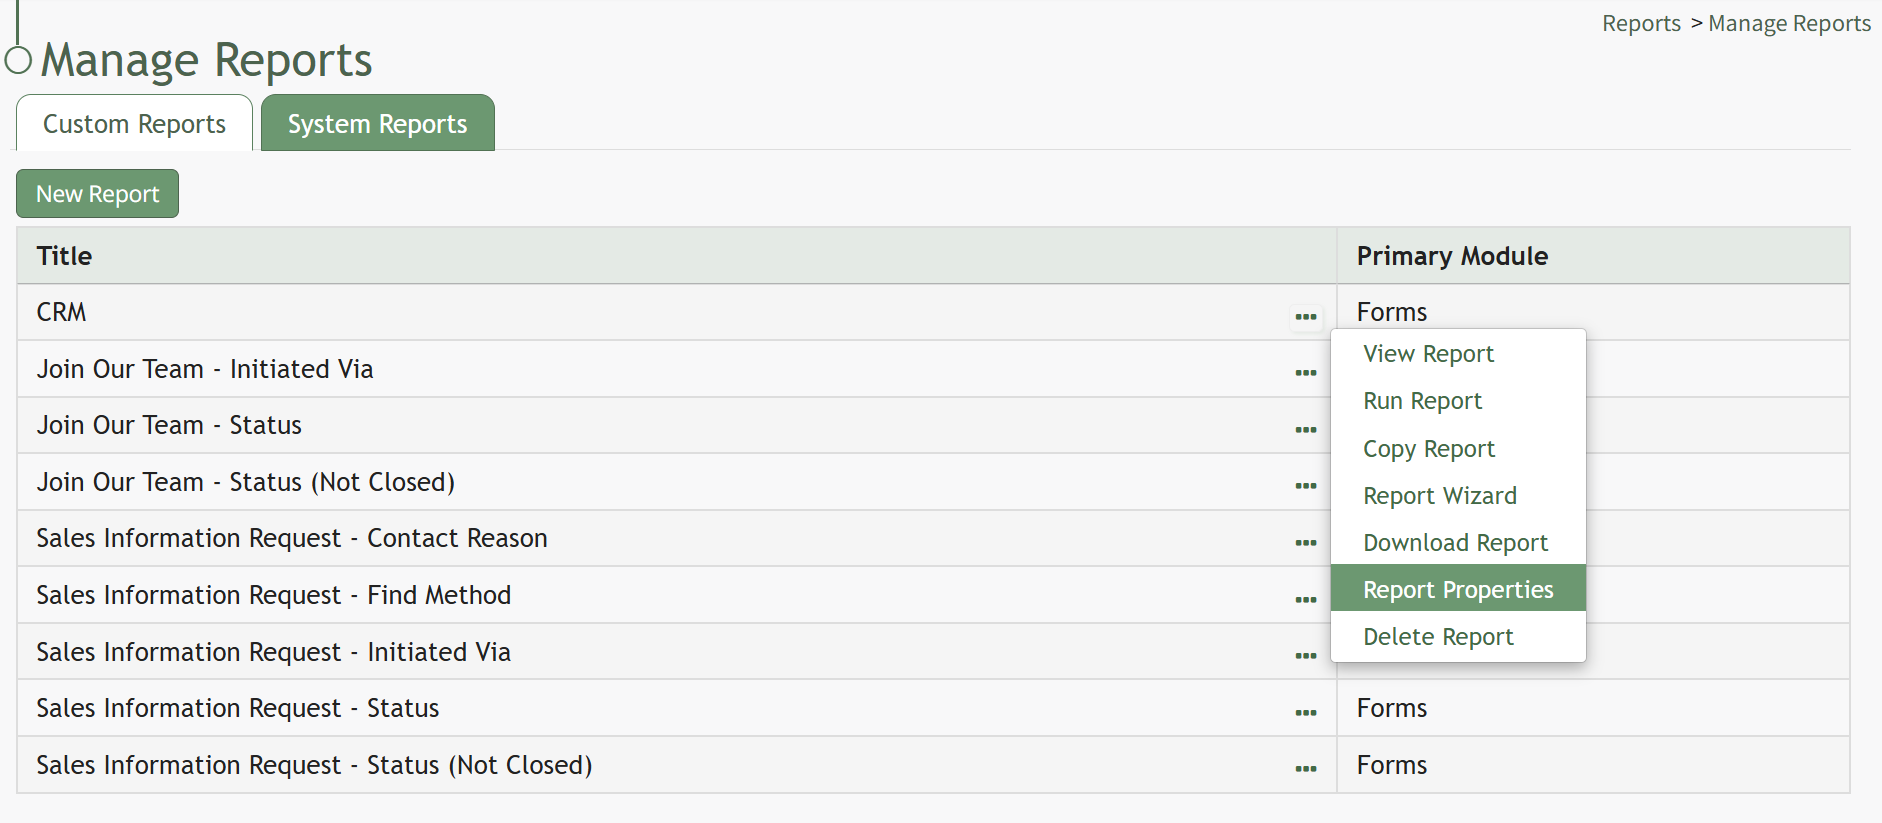
Select “Report Properties” opening the Report Properties Modal.
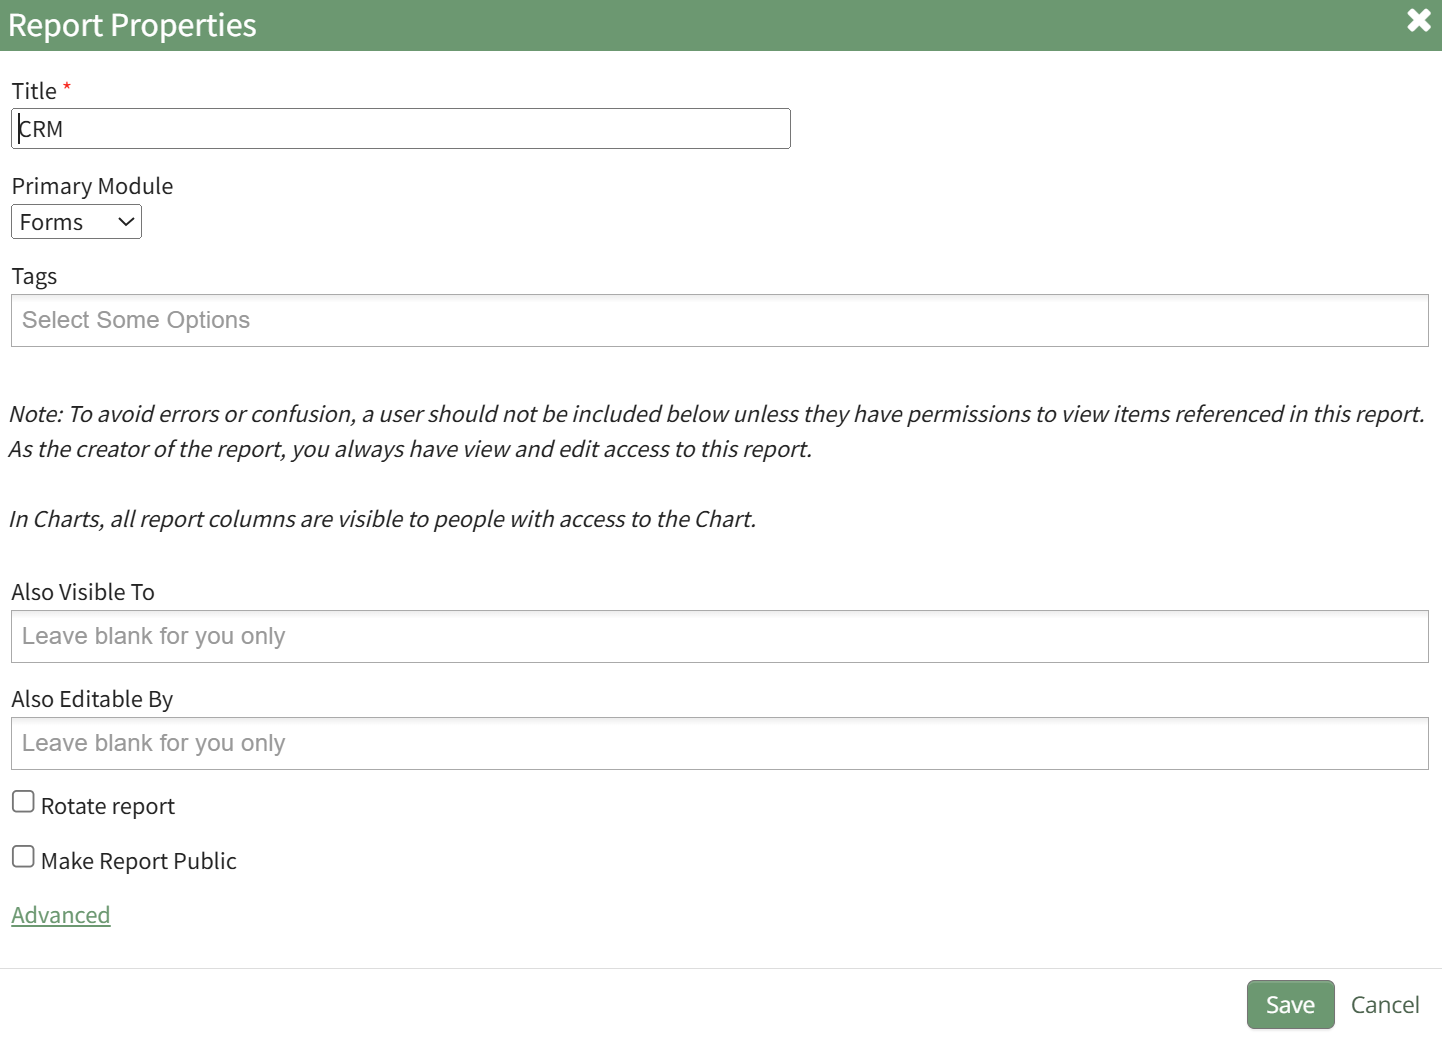
Refer to the New Report Modal Comments Table for an explanation of Edit Report Modal inputs.
New Report Modal Comments | ||
Input | Comments | |
Title | Input a title for the new report (a required field). | |
Primary Module | Select the primary module from a dropdown menu with the following options: Assets, Dispatch, Forms, Meetings, and People. | |
Tags | Select open, restrictive, or permissive tags as desired. | |
Also Visible To | A dropdown menu includes the options: People I Supervise, All Eligible Accounts, Certification Roles and Individual People. | To avoid errors or confusion, a user should not be included below unless they have permissions to view items referenced in this report. |
Also Editable By | ||
Rotate Report Checkbox | When the Rotate Report Checkbox is selected, the information in the rows of the first column become the column headers. (The x and y axis are switched.) | |
Make Report Public Checkbox | When the Make Report Public Checkbox is selected, the modal expands to include a textbox for the Link Path. The URL for the report will be https://[subdomainname].kastrack.com/reports/view-report[LinkPath} | |
Advanced Options | ||
Report SQL | Clicking the “Advanced” link opens a Report SQL textbox, an input area for writing SQL queries that can define the data the report will show. | |
Select the “Save” button after making your desired changes and you’ll return to the Custom Reports Table.

Selecting an option as a column header for the report will change the button from blue to green and will have a check mark to the left of the column title. All items selected will show under Column in the header on the horizontal blue line. The columns can be dragged and dropped for correct placement in the report. Icons used on the Column Tab are shown in the Column Tab Icons Table below.
Column Tab Icon Explanations Table | ||
Icon | Explanation | Image |
| When the down arrow icon shows next to the Column Tab header, the report columns are listed in a horizontal row, and clicking on the arrow will change it to a vertical display. |
|
| When the right arrow icon shows next to the Column Tab header, the report columns are listed vertically and clicking on the arrow will change it to a horizontal display. |
|
| The trashcan icon will automatically delete the selected column header when clicked. | |
| The calendar icon shows for any system date fields and opens the Configure Date Modal which allows an individual to select the desired date format for the report. |
|
| The gear icon will open the Configure Function Modal, which is used to configure one of the four special functions (Average, Count, Function, Sum). |
|


The possible headers displayed on a report vary based on the primary module selected for the report. A list of possible column headers associated with each primary module and the tables contained within the module are shown on the Possible Report Column Headers Table below.
Possible Report Column Headers by Module | ||
Module | Table | Entries |
Special | Avg (column), Count, Function, Sum (Column) The Function option allows advanced customization by technically skilled users. If you would like to use this and need help, please contact the KAStrack support team. | |
Assets | Assets | Asset Status, Child Deferred, Created By, Creation Date, Critical, Critical Spares, Deferred, Description, Model Number, Serial Number, Tagging Type, Title, Title (Link), URL, URL (Link), Warn Status (Color), Warn Status (Critical) |
Asset Types | Asset Type, Created By | |
Manufacturers | Manufacturer, Created By | |
Meters | Last Reading, Last Reading (Date), Last Reading (Value), Logged by User, Meter Name | |
Meter Logs | Reading, Reading Date, Reading User ID | |
Asset Fields / Asset Tasks | Both of these options will expand to include the asset fields and asset tasks that are specific to your subdomain. | |
Dispatch | Dispatches | Can View Incidents, Created By (user), Creation Date, Dispatch #, Dispatch Closed Date, Dispatch Date, Distribution List Footer, GUID, Last Update, Notes, Pending Approval, Status, Title |
Itinerary Items | Actual Arrival or Start Date, Actual Departure or Finish Date, Arrival or Start Delay (minutes), Arrival or Start Status, Departure or Finish Delay (minutes), Departure or Finish Status, Dispatch #, Expected Arrival or Start Date, Expected Departure or Finish Date, Incident, Location or Activity Name, Overall Status, Type | |
Forms | Forms | Identifier, Status, Title |
Entries | This open will expand to include form entries that are specific to your subdomain. | |
Meetings | Meeting Participants | Participant |
Meeting Instances | Archived, Date, Non-KAStrack Participants, Presenters, Subject, Summary | |
Meetings | Archived, Count, Date Created, Day of Month, Day of Week, Description, End Date, Meeting Frequency, Meeting Interval, Month, Prioritized, Recurring, Start Time, Title, Visibility | |
People | People Accounts | Account, Additional Custom Field for Email, Address 1, Address 2, Approved By, Approved Date, Email, Email Verification Required, Email Verified Date, Employee ID, Field for BCC Email, Field for CC Email, Field for Send Comm CC Email, First Name, Home Page, Inactive, Last Active, Last Name, Map A&P #, Other Account Field, Password Token Expiration, People Report Status, Phone, Photo, Registration Date, Sensitive Account Field, Status, Timeout, Username |
Certification Roles | Certification Role Name | |
Certifications | After Duration, After Interval, After Period, Attachment Required, Auto Approve, Auto Approve Activity, Before Duration, Before Interval, Before Period, Certification Expires, Certification ID, Certification Information, Certification Interval, Certification Name, Completion Cost, Completion Duration, Completion Interval, Coordinator ID, Due Duration, Due Interval, Duration of Certification, Expiration Style, Extended Interval, Force Date, Force Expiration, Generate Certificate, Hide Attachments from QR Reports, Hide Attachements from Shared Reports, Hide Expiration, Hide from QR Reports, Hide from Shared Reports, Notification Duration, Notification Interval, Refresher Certification Duration, Refresher Certification Interval, Refresher Completion Cost, Refresher Completion Duration, Refresher Completion Interval, Refresher Due Duration, Refresher Due Interval, Refresher Extend Interval, Refresher Notification Duration, Refresher Notification Interval, Refresher Training, Send Attachments, Training ID, URL | |
Supervisors | Supervisors, UserID, Username | |
Trend User Certs (by user and supervisors) | Account, Date, Is Me, Percentage Valid Certifications for Supervised Users, Percentage Valid Certifications for User, Supervised By Me, Total Certifications for Supervised Users, Total Certifications For User, Valid Certifications for Supervised Users, Valid Certifications for User | |
Trend User Certs (by certifications) | Certification, Date, Percentage Valid for All Users, Total Assigned For All Users, Total Valid For All Users | |
Trend User Certs (by certifications by supervisors) | Account, Certification ID, Date, Is Me, Percentage Valid for Supervised Users, Supervised by Me, Total Assigned for Supervised Users, Total Valid for Supervised Users | |
Trend User Certs By Roles (by Users and Supervisors) | Account, Date, Is Me, Percentage Valid Certifications for Supervised Users, Percentage Valid Certifications for User, Percentage Valid Roles for Supervised Users, Total Certifications for User, Total Roles for Supervised Users, Valid Certifications for Supervised Users, Valid Certifications for User, Valid Roles for Supervised Users | |
User Certification Expiration Dates | The options presented in this table are specific to the certifications required in your subdomain. | |
User Certifications | Approved By, Approved Date, Certification ID, Completion Date, Expiration Date, Instructor ID, Submitted Date, User ID | |
Restrictions Tab
Restrictions and dynamic restrictions are
established on the Restrictions Tab of the Report Wizard. The Restrictions Tab can be utilized to limit the data
shown on a report based on certain conditions being met.
Restrictions incorporates REGEX to allow detailed customization. More information about REGEX can be found in the Supplemental Resources.

Multiple restrictions can be created with an and
/ or applied.
No slashes can be used when specifying the value for a restriction.
Dynamic restrictions can be utilized whenever a report features date related entries.

How To: Include Dynamic Restrictions on a Custom Report
To include dynamic restrictions on a date field in a custom report, go to the Custom Report Tab on the Manage Reports Page and select the three-dot icon next to the report title opening the context menu.
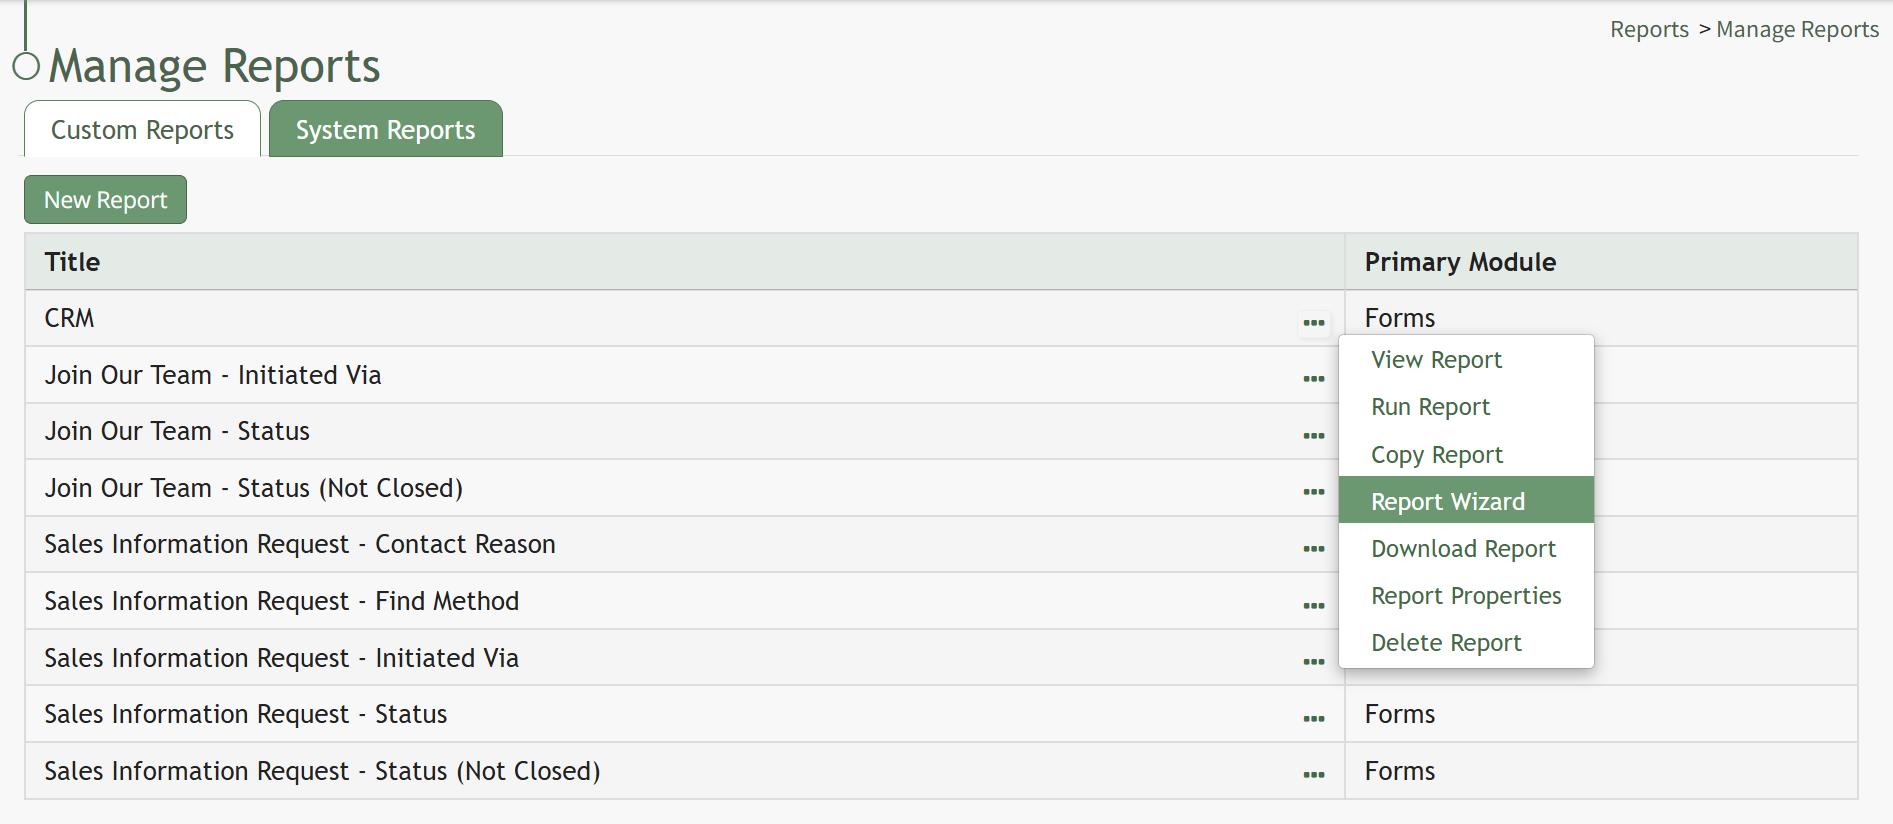
Select “Report Wizard” and open the Restrictions Tab on the Report Wizard Page. Select the plus “+” icon to open the New Restriction Modal.

Select the column for the date-related field you would like to add dynamic restrictions to from the dropdown menu options provided. Select “Save” on the modal.

The dynamic restriction field now shows on the Restrictions Tab. Select the “Save Tab” to save the dynamic restriction. When you run the report, the dynamic restrictions will now show and allow for additional filtering of the chosen date-related column.

Options Tab
The Options Tab of the Report Wizard Page controls other optional settings for a report. Currently, there is one available option that can be used to select a column header for default sorting.

Multiple options can be selected by clicking the
plus “+” icon.
Changes must be saved by clicking the Saved Tab before leaving the Report Wizard Page.
Preview Tab
The Preview Tab of the Report Wizard Page shows a preview of the report and any changes that have been made to the report.

Dynamic headers are not included on the preview page, nor are the report header or report icons. The preview will show the first five lines of the report, but the clickable link “Show All” can be selected to show all data on the preview page.
Save Tab
The Save Tab does not open a new tab. By clicking the tab, any changes made on the Report Wizard are saved.