# Reports: Introduction

# Reports Module Summary

The Reports Module is where reports are generated, accessed, and stored. Charts based on report data are also managed in this Module. The reports module uses data encapsulated within other KAStrack Modules.

[![image.png](https://kaswiki.kastrack.com/uploads/images/gallery/2025-12/scaled-1680-/MDlimage.png)](https://kaswiki.kastrack.com/uploads/images/gallery/2025-12/MDlimage.png)

The Reports Module contains the Reports Home Page, Charts Page, Manage Reports Page (with Custom Reports and System Reports tabs), and the Settings Page (with a Module Levels tab). Reports are rooted in primary modules. All charts created in KAStrack must be generated from a specific report.

# System Reports and Custom Reports

The System Reports Tab houses the System Reports table that lists 11 possible system generated reports that are based on data from the Accounts, Finance, and People Modules.

<p class="callout info">There is a 12th Systems Reports Table, the Send Communications Log, which is only available by permission (set in the Communications Module).</p>

---

The Custom Reports Tab houses the Custom Reports Table showing any available custom reports created by users.

Custom charts can be generated on data from the Assets, Dispatch, Forms, Meetings, and People Module.

# Understanding a Report Page

To the right of the report name header are six icons that serve as quick links for specific actions.

[![image.png](https://kaswiki.kastrack.com/uploads/images/gallery/2025-12/scaled-1680-/CiDimage.png)](https://kaswiki.kastrack.com/uploads/images/gallery/2025-12/CiDimage.png)

Each report icon is explained in the table below.

<table id="bkmrk-report-icon-explanat"><colgroup><col style="width: 117px;"></col><col style="width: 240px;"></col><col style="width: 445px;"></col></colgroup><tbody><tr><td colspan="3">**Report Icon Explanations**

</td></tr><tr><td>**Icon**

</td><td colspan="2">**Explanation**

</td></tr><tr><td>[![image.png](https://kaswiki.kastrack.com/uploads/images/gallery/2025-12/scaled-1680-/X85image.png)](https://kaswiki.kastrack.com/uploads/images/gallery/2025-12/X85image.png)

</td><td colspan="2">The spreadsheet icon converts the table into a datatables table format (allowing for filtering by column and pagination of the table).

</td></tr><tr><td>[![image.png](https://kaswiki.kastrack.com/uploads/images/gallery/2025-12/scaled-1680-/Qypimage.png)](https://kaswiki.kastrack.com/uploads/images/gallery/2025-12/Qypimage.png)

</td><td colspan="2">The PDF icon opens a web-based PDF of the report in the same browser tab.

</td></tr><tr><td>[![image.png](https://kaswiki.kastrack.com/uploads/images/gallery/2025-12/scaled-1680-/827image.png)](https://kaswiki.kastrack.com/uploads/images/gallery/2025-12/827image.png)

</td><td colspan="2">The excel icon will download the report in an excel (.xlsx) file to your personal device.

</td></tr><tr><td rowspan="7">[![image.png](https://kaswiki.kastrack.com/uploads/images/gallery/2025-12/scaled-1680-/nFOimage.png)](https://kaswiki.kastrack.com/uploads/images/gallery/2025-12/nFOimage.png)

</td><td rowspan="7">The download icon opens the Download Modal which allows an individual to select from seven different formats to download the report from a dropdown menu. Possible download formats are listed to the right.

<details><summary>How To: Download a Report</summary>

{{@276}}

</details></td><td>Comma Separated Values (.csv)

</td></tr><tr><td>Tab Separated Values (.tsv)

</td></tr><tr><td>Other Separated Values (.txt)

</td></tr><tr><td>Open Document Format (.ods)

</td></tr><tr><td>Excel 97 (.xls)

</td></tr><tr><td>Excel 2007 and later (.xlsx)

</td></tr><tr><td>PDF

</td></tr><tr style="height: 10px;"><td>[![image.png](https://kaswiki.kastrack.com/uploads/images/gallery/2025-12/scaled-1680-/chOimage.png)](https://kaswiki.kastrack.com/uploads/images/gallery/2025-12/chOimage.png)

</td><td colspan="2">The chart icon opens the Chart Wizard Modal, allowing an individual to create a chart from the data generated by the report.

<details><summary>Hot To: Create a Chart</summary>

{{@279}}

</details></td></tr><tr><td>[![image.png](https://kaswiki.kastrack.com/uploads/images/gallery/2025-12/scaled-1680-/nDAimage.png)](https://kaswiki.kastrack.com/uploads/images/gallery/2025-12/nDAimage.png)

</td><td>The external link icon opens the External Connection Modal which offers a detailed explanation on how to transmit report data to Power BI.

</td><td>[![image.png](https://kaswiki.kastrack.com/uploads/images/gallery/2025-12/scaled-1680-/9P2image.png)
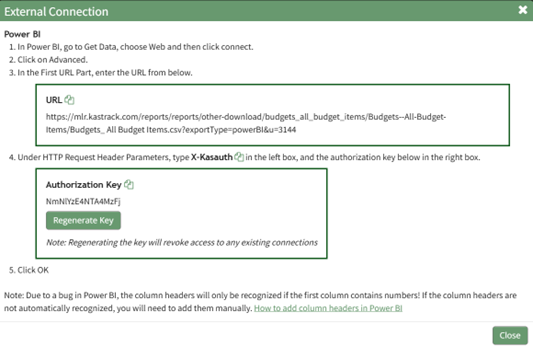
](https://kaswiki.kastrack.com/uploads/images/gallery/2025-12/9P2image.png)

</td></tr></tbody></table>