Reports: Introduction
Reports Module Summary
The Reports Module is where reports are generated, accessed, and stored. Charts based on report data are also managed in this Module. The reports module uses data encapsulated within other KAStrack Modules.

The Reports Module contains the Reports Home Page, Charts Page, Manage Reports Page (with Custom Reports and System Reports tabs), and the Settings Page (with a Module Levels tab). Reports are rooted in primary modules. All charts created in KAStrack must be generated from a specific report.
System Reports and Custom Reports
The System Reports Tab houses the System Reports table that lists 11 possible system generated reports that are based on data from the Accounts, Finance, and People Modules.
There is a 12th Systems Reports Table, the Send Communications Log, which is only available by permission (set in the Communications Module).
The Custom Reports Tab houses the Custom Reports Table showing any available custom reports created by users.
Custom charts can be generated on data from the Assets, Dispatch, Forms, Meetings, and People Module.
Understanding a Report Page
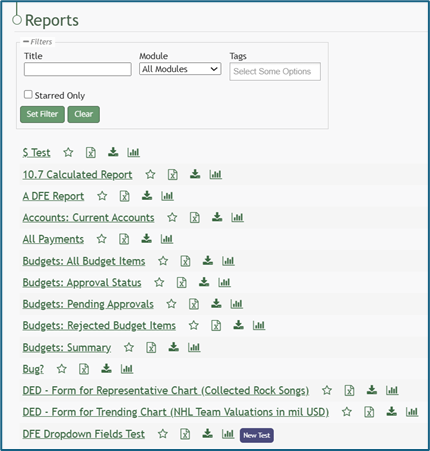
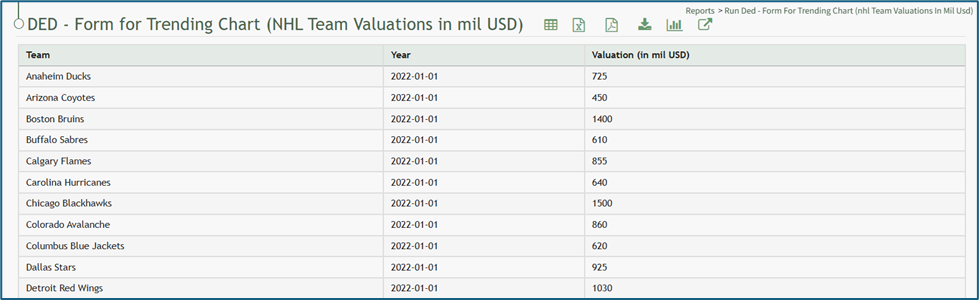
To the right of the report name header are six icons that serve as quick links for specific actions.

Each report icon is explained in the table below.
Report Icon Explanations | ||||||||||||||||||||||||||||||||||||||||
Icon | Explanation | |||||||||||||||||||||||||||||||||||||||
| The spreadsheet icon converts the table into a datatables table format (allowing for filtering by column and pagination of the table). | |||||||||||||||||||||||||||||||||||||||
| The PDF icon opens a web-based PDF of the report in the same browser tab. | |||||||||||||||||||||||||||||||||||||||
| The excel icon will download the report in an excel (.xlsx) file to your personal device. | |||||||||||||||||||||||||||||||||||||||
| The download icon opens the Download Modal which allows an individual to select from seven different formats to download the report from a dropdown menu. Possible download formats are listed to the right. How To: Download a ReportTo download a report, go to the Home Page of the Reports Module. There are two icons to the right of the Report Title that allow an individual to download a report.
Selecting the excel icon will automatically download the report to your personal device. Selecting the download icon will open the Download Modal. There are seven different download options to choose from on the dropdown menu.
Select the “Generate” button and KAStrack will download your report based on the method of your choosing. The icons to download a report can be found within a specific report and the Manage Reports Page (for individuals with an Admin access level). | Comma Separated Values (.csv) | ||||||||||||||||||||||||||||||||||||||
Tab Separated Values (.tsv) | ||||||||||||||||||||||||||||||||||||||||
Other Separated Values (.txt) | ||||||||||||||||||||||||||||||||||||||||
Open Document Format (.ods) | ||||||||||||||||||||||||||||||||||||||||
Excel 97 (.xls) | ||||||||||||||||||||||||||||||||||||||||
Excel 2007 and later (.xlsx) | ||||||||||||||||||||||||||||||||||||||||
| The chart icon opens the Chart Wizard Modal, allowing an individual to create a chart from the data generated by the report. Hot To: Create a ChartTo create a chart, go to the Home Page of the Reports Module and open the report you wish to use for the necessary chart data. How To: Run a ReportTo run a report, go to the Home Page of the Reports Module.
Click the name of the report you wish to run.
Select the chart icon to the right of the report title header. This opens the Report Module Chart Wizard Modal. The chart icon for a specific report is also accessible on the Home Page of the Reports Module.
After specifying the appropriate inputs for the chart, select “View Chart” to see a preview of the representation of the data. If no additional changes are needed, select “Save Chart”. A confirmation modal states, “The chart has been saved.”
The new chart is now visible on the Charts Page of the Reports Module. | |||||||||||||||||||||||||||||||||||||||
| The external link icon opens the External Connection Modal which offers a detailed explanation on how to transmit report data to Power BI. |
| ||||||||||||||||||||||||||||||||||||||